
Up Side Down!
It was a rocky road to a positive 1st Quarter performance for stock investors, with only a select few sectors carrying the gains. Here are some highlights:
- At the first turn, the Canadian market was up 6.1% while the U.S. Market (S&P500) was up 5.9% (but just 1.8% in USD terms).
- The top performing market was actually Greece!!! The Greek market was up 19.7% for the quarter and 79.5% for the preceding 12 months! Greece’s strong returns were closely followed by Italy, with a positive return of 62% gain for the past 12 months, and Spain, with a gain of 54.5% for the 12-month period. All performance numbers are quoted in CAD terms.
- Although these markets made headlines 24 months ago because of their tenuous economic situation, their strong recovery has drawn little interest in the regular news cycle…nothing sells news like bad news!
- The new Cold War? Russia invaded part of a Sovereign nation—right after the Olympic coverage had left the region. And the world said nothing. Is this another Munich? For those who don’t remember (or don’t recall reading about it in history books or even Wikipedia), in 1938, Hitler, Mussolini, Daladier and Chamberlain signed the Munich Pact which essentially gave Germany sovereign control over what was known as Sudetenland. Sudetenland was a part of what was then Czechoslovakia, with three million ethnic Germans and within the country’s industrial and financial heartland. This territory also happened to contain Czechoslovakia’s main border defenses as well as many military installations. For those of us who are history buffs, this recent refrain from Russia is all too familiar.
Market Drivers
Investors are focusing on two main drivers:
- What will the Fed do? Tapering of the money supply is now a reality, and they are slowly increasing the speed at which they are tapering…10Bil on 85Bil, now 10Bil on 75Bil, etc. Although the trend means slightly tighter money supply in the short term, it will slow the growth of inflation long-term. It’s also an indication that the Fed believes the economy is stabilizing—thus requiring smaller stimulus injections.
- The Global Economy. We are all focused on places like China, Japan, Europe and the U.S. However, it is important to remember that stocks have a perverse history of sluggish performance in a sound economy. After a five-year run-up, stocks are no longer a bargain and complacency is high amongst investors. Some of you might recall 1998 or 2007.
U.S. Market
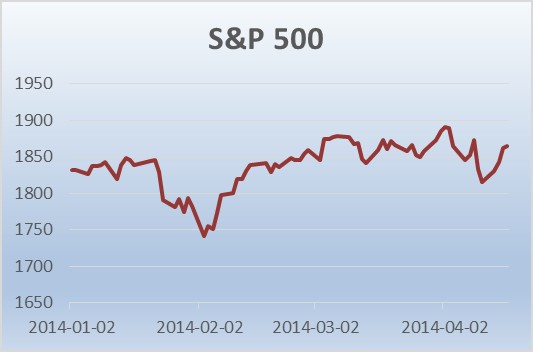
The U.S market was very volatile during the first quarter of 2014. This was indeed quite a change from 2013 where we experienced very
little volatility and essentially a consistent move up in the markets.
The return for the S&P 500 was 1.8% (USD) with a 5.4% pullback in late January. The chart at left illustrates the performance of the S&P 500, while the chart below depicts an interesting trend: sector rotation.
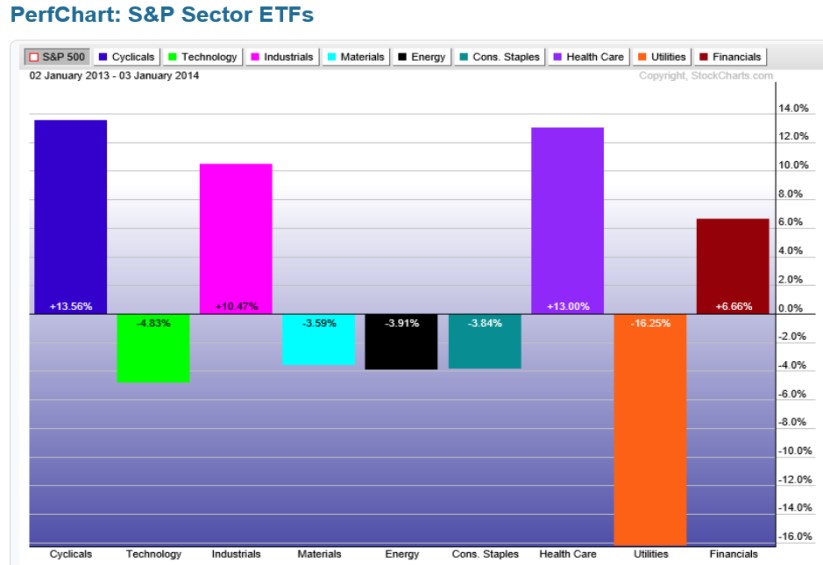
Sector rotation essentially means that previous “hot” sectors of the economy are sold off in favour of new sectors: these new “hot” stocks are often laggards of the previous period.
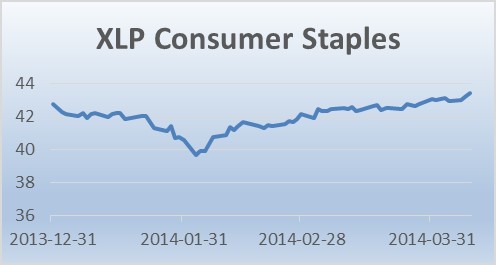
You can see from the chart below which illustrates the performance of each market sector for 2013. The defensive sectors such as utilities and consumer staples were market laggards.
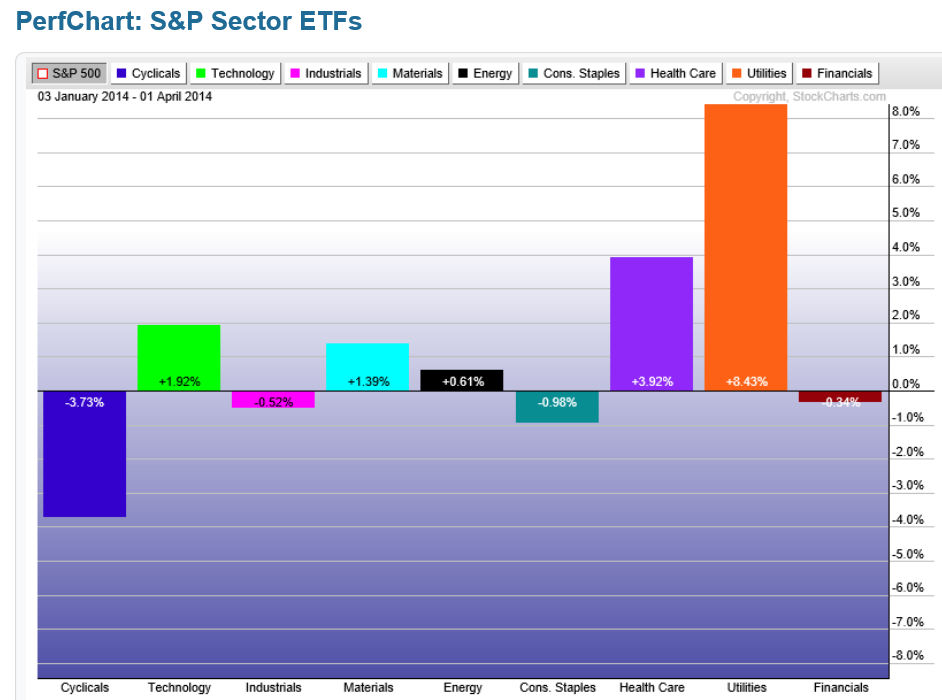
However the next chart below illustrates the performance of the same sectors during the first quarter of 2014.
The results are almost polar opposites. The lessons are that a well-diversified portfolio is critical to long term performance and when making new investments, one must be aware of the direction of the prevailing market direction.
Canadian Market
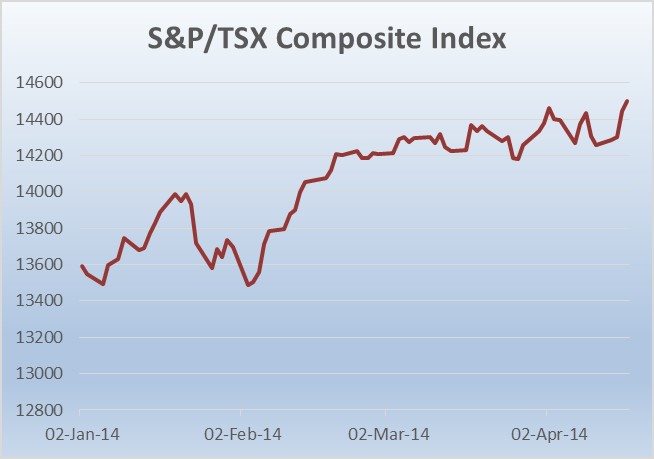
The Canadian market also witnessed significant volatility early in the quarter, as the market sold off 4% in February but still turned in a total return of 6.1% for the S&P/TSX Composite Total Return Index.If we look at the underlying performance of the market, we see that the Energy sector (Blue line on the left graph) came on strong late in the quarter and it continues as of the time of this writing. In addition, Utilities (Red line on the left graph) and the Consumer Staples (below) sector were the largest contributors to the performance of the Canadian market. Materials and Health Care were the worst performing sectors.
Europe
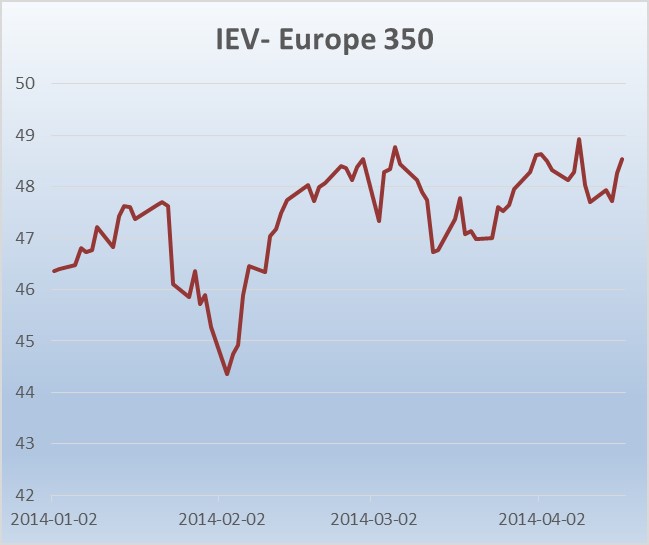
The IEV exchange traded fund which represents Europe’s largest 350 companies (illustrated on the left), suffered a selloff in late January with a 6.5% pullback before ending the quarter on a small positive note of 1.5%.
- Aside from strong returns in Greece, Italy and Spain, the European recovery is a slow one…much like the U.S. was back in 2010-2011
- It is our expectation that the European Central Bank will intervene with its own version of “Quantitative Easing.”
- The corollary to this central bank intervention would be a boost to stocks—and the economy at large—as was the case in the U.S. and later in Japan.
What Moved the Markets?
Let’s take a step back and offer some perspective on all the moving parts:
Interest Rates
Most investment values are predicated on interest rates because, quite simply, interest rates represent the cost of money at a particular moment in time. When interest rates are low, future income is worth more than when interest rates are high. Investors will try to establish the worth of this income in the future by predicting future interest rates.
The Canadian Bond Market
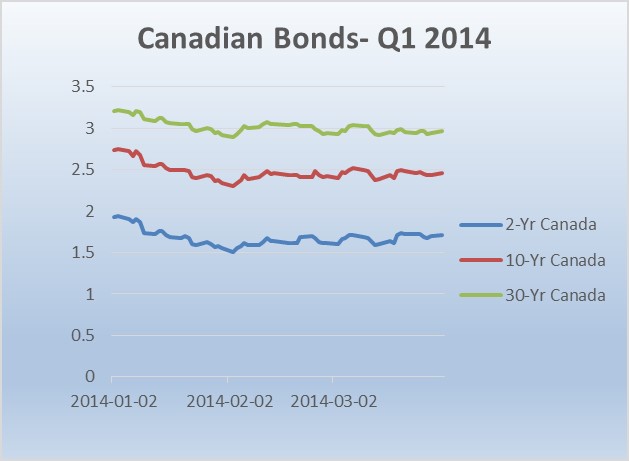
Illustrated on the left are the three benchmark yields for the Canadian Bond market based on data compiled by the Bank of Canada.
As the chart on the left illustrates, interest rates were stable, with very little to report. Over the course of the quarter, bonds offered positive returns along with their fixed income cousins: preferred shares.
The U.S. Bond Market
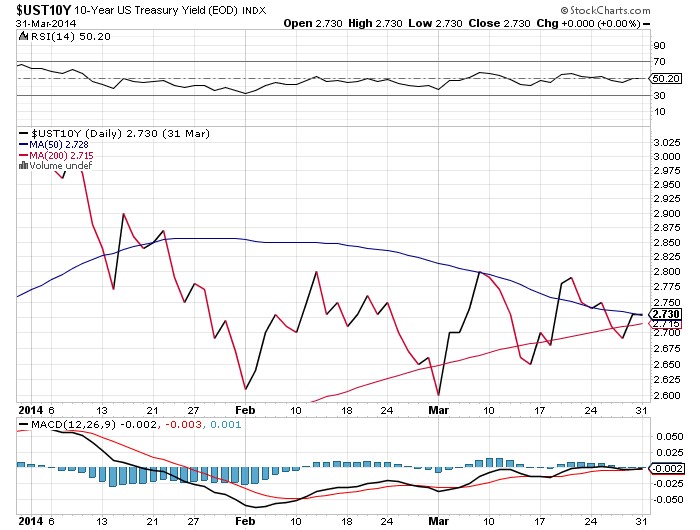
As illustrated by the graph on the left that tracks the 10-year yield on U.S. Treasury bonds, the U.S. Bond experienced more volatility than their Canadian counterparts with a bias toward lower yields.
Lower yields correspond to higher prices. So while stocks were selling off early in the quarter, bonds were appreciating in value. The explanation for this rotation and counter action would be that investors were reducing their equity holdings in order to add to their bond allocations.
Market Undercurrents
Canada
At the risk of sounding like a broken record in regards to the Canadian Economy. The West is doing well, particularly anything related to oil exploration. Natural gas prices have perked up thanks to the never-ending winter, and new projects to export natural gas are being planned—although they are a long way from approval. Ontario’s economy is not doing well…but a lower loonie could bring manufacturing back to life. Quebec will see four or five years of political stability, we hope thanks to the Liberal majority. In short, the Canadian economy is still languishing but not yet stalling. The Maritimes are still not anywhere near full potential, but plans for a Trans Canadian crude pipeline with the ultimate destination of Saint John’s deep water port would bring positive economic momentum. However, this pipeline is anything but built just yet.
We have kept our Canadian selection somewhat the same this quarter, save for a few housekeeping trades. We continue to search for names that offer both capital growth potential and proven dividend growth—a difficult task indeed.
United States
The U.S. market offers our portfolios a little more breathing room to identify good investment candidates. While the market cannot be qualified as “cheap”, we have found a few new names that we will be adding to our holdings. We have also sold a few names that reached their sell target prices.
Emerging Markets
We continue to be wary of these markets and, thus far, have very little, if any, direct exposure in these markets. We continue to monitor the situation closely as I do not have any interest in “catching a falling knife.”
Europe
At the end of the 4th Quarter of last year, we wrote the following: Europe continues to be the region that we find most appealing. The landscape reminds us of what we foresaw two or three years ago in the U.S. We see:
- A currency that has room to appreciate versus the USD and CAD
- A central bank that is increasingly active in lowering interest rates to increase asset prices
- Governments ready and willing to take on the heavy task of structural reforms
- Business leaders having paid and learned from the excesses of the past decade
- Valuations that are at significant discounts to their American and Canadian peers
- Financial results that, in many cases, leave room for significant dividend increases.
What has changed since the January report is that, as expected, the European Central Bank is now on record as being willing to use all available options, including quantitative easing, to ensure that the continent’s economy remains on track. This is quite a change from just 12 months ago and an echo of what we witnessed in the U.S. just a few years earlier—and the results were certainly very positive for investors of American equities.