Executive Summary
All-time highs all around
Unequivocally, 2019 has been a year for the record books. We have to go back to the late ’90s or perhaps the ominous 2007 calendar year for another period where most asset classes had a positive performance. From gold and oil to small and large capitalized stocks, European and emerging markets, all increased in value. One must look far and wide to find negative-performing asset classes.
Most of the positive performance happened early in the year and in the last month. The talk about the direction of interest rates weighted heavily on investors, as well as international trade issues, and political turmoil in Washington, London and Hong Kong, to name but a few. Yet most asset classes performed truly surprisingly.
Key Takeaway
Rising markets can make professional investors overly cautious at times. However the year just ended was the epitome of a “risk-on” market where risk-taking was enticing and rewarded. High-flying technology stocks with growing sales and fantastic prospects, but no earnings, were the top performers.
It is not all rainbows and unicorns though. Most of the issues that worried investors in the late 2018 are still here today. Nevertheless, investors viewed positive outcomes as the most likely scenario, and thus bid up prices.
Conclusion
Positive years like the one that just ended are enjoyable but should not be considered the norm. Our path and our approach do not change despite one great year. We still need to worry about potential downside risk while seeking out profitable investment opportunities. Great market returns make the latter activity just a little bit more arduous but does not change the former concern. We remain vigilant and constructive at the same time.
Full Report

THE THREE KEY DRIVERS
- A steepening yield curve in the U.S., thanks to lower short-term interest rates.
- Trade war resolution on the horizon.
- A healthy economic climate, due to good corporate growth combined with impressive employment participation and positive wage gains.
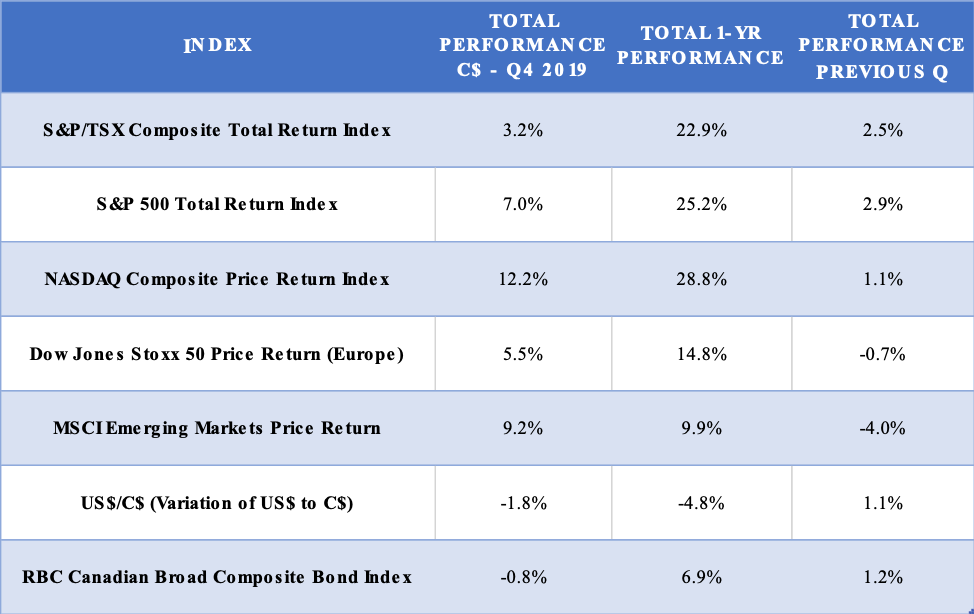
PERFORMANCE SUMMARY
- The U.S. market turned in an outstanding performance, led by technology names.
- Europe and emerging markets had a great year and are at or near all-time highs.
- The loonie rallied while the euro was steady versus the U.S. dollar.
- Falling interest rates drove the bond market to yield a solid, equity-like return in the final quarter.
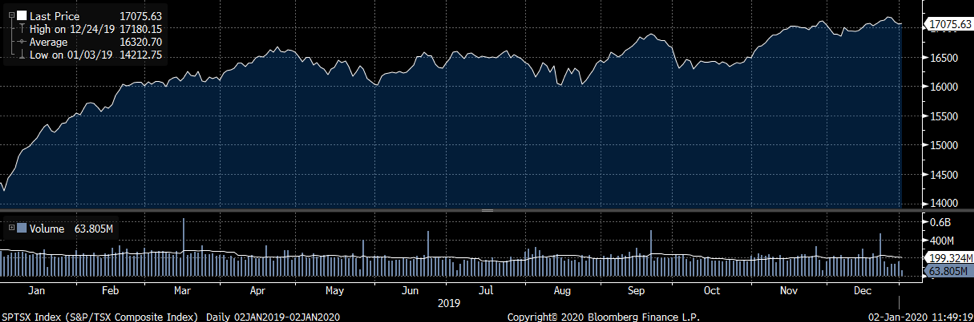
CANADIAN MARKET SUMMARY

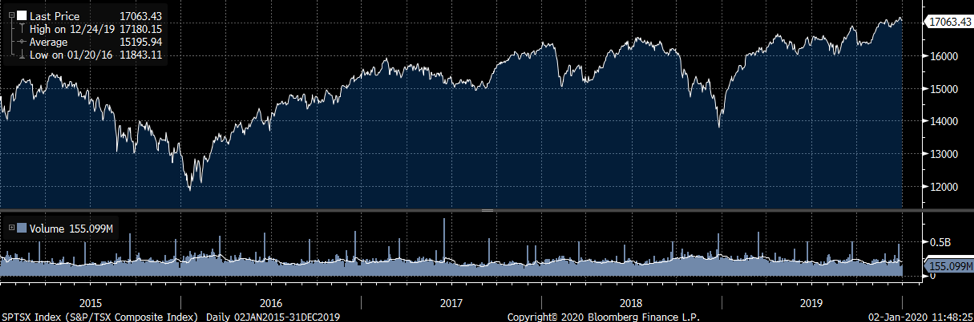
- The Toronto Stock Market gave investors a Christmas present by surpassing 17,000 level on December 24 – see the above 5-year price chart for the S&P/TSX index.
- The strong performance occurred mostly in the first four months and in the last eight weeks of 2019. The chart below shows the price chart for the S&P/TSX index for 2019. The noticeable lack of volatility is an unusual phenomenon.
CANADA: ECONOMY
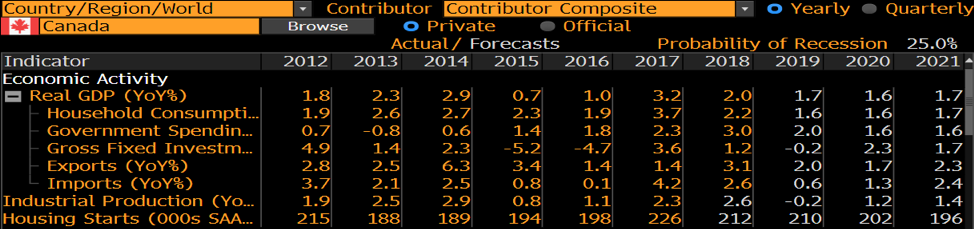
- Canada’s expected growth rate for 2019 (at the time of writing, actual data are not yet available) is quite low, and rests on expectations of increased household consumption and government spending.
- The Fixed Investment Spending component is negative once again (as in 2015 and 2016). This means that future economic productivity will be lower. As well, Industrial Production, which is also weak, is a notable negative standout. For now, the expectation is for a rebound in these underperforming areas in 2020.
- The Bloomberg probability of a recession stands at 25% (it was at 30% last quarter).
CANADA: CORPORATE PROFITS
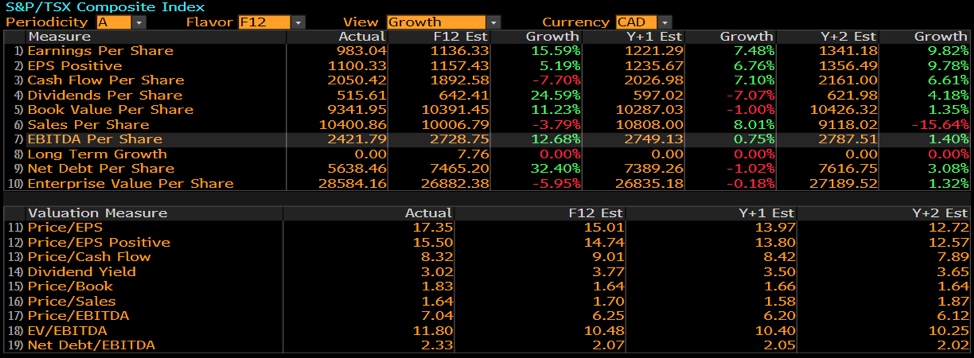
- Corporate profit expectations are robust, which is perplexing. An explanation lies in the rebound in oil prices, which has boosted oil and gas producers’ profits.
- Corporate debt is a concern, as it is growing faster than sales, cash flow, or earnings. This higher debt is due to low interest rates, which create an incentive to borrow.
CANADA: EQUITY VALUATIONS
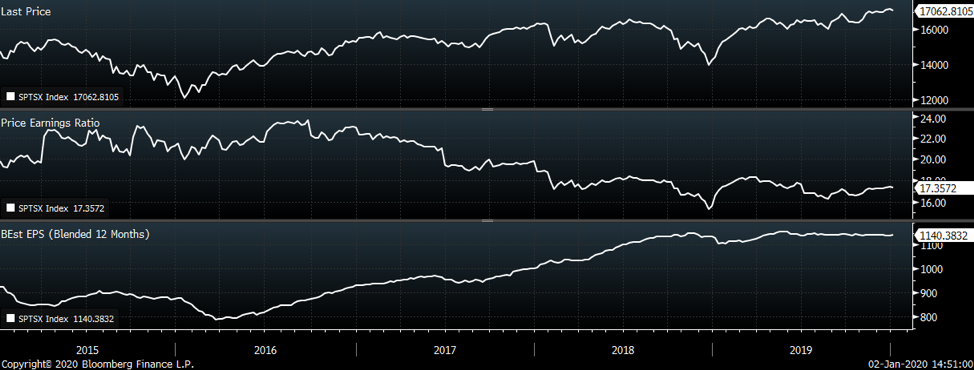
- The top panel shows the level of the S&P/TSX since 2014. The recent high is a new record for the index.
- Despite this record level, valuations (shown in the second panel) are quite reasonable.
- The low price/earnings ratio can be explained by healthy earnings that are also at an all-time high.
- Should the resources sector, such as oil and gas or mining, benefit from improving fundamentals, the TSX earnings can be expected to accelerate from here.
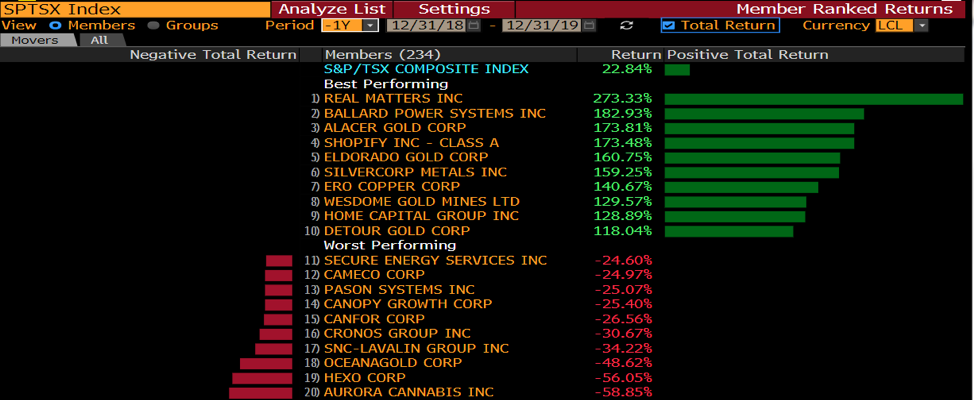
CANADA: MARKET LEADERSHIP
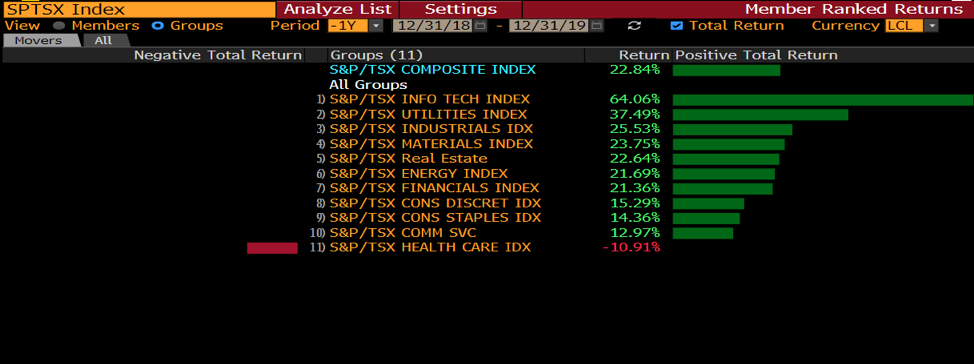
- The Canadian market performance was strong, with a broad participation by all sectors (below chart). The only laggard is the S&P/TSX Health Care Index, largely comprised of cannabis producers that continued their precipitous slide.
- High-flying sectors, such as junior gold miners and technology, lead the way in 2019. The worst performers were made up of cannabis names and a few “special” cases.
UNITED STATES: MARKET SUMMARY
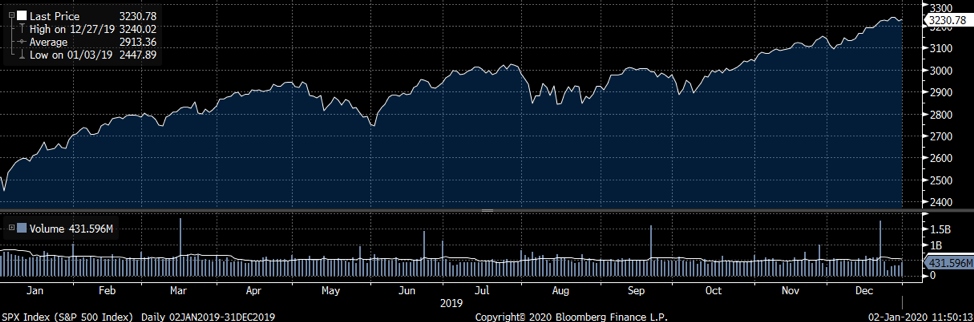
- The U.S. market, as illustrated by the S&P 500 index above, finished at an all-time high. In addition, the NASDAQ also closed at an all-time high in 2019 (8,972 points), and the Russell 2000 index closed this year at 1,668, which is just a few points shy of the all-time high reached in late September.
- As depicted below, the rally of the S&P 500 last year did not include any significant downturns. Volatility was mostly to the upside, with the bulk of the advance observed through the first four months and the last two months of 2019.
UNITED STATES: ECONOMY
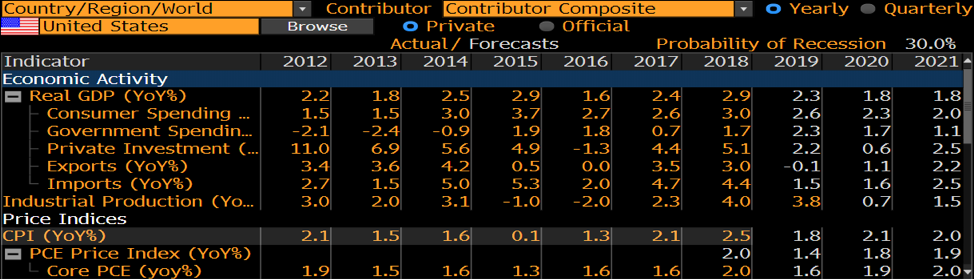
- S. economic expectations for 2019 have steadied; anticipated growth stands at 2.3%, but is predicted to taper off in 2020 and beyond.
- Trade wars, slower global economic growth and geopolitical tensions are having a negative impact on exports, industrial production and private investments.
- The Bloomberg recession probability is currently at 30%, slightly below the last quarter’s 35% reading.
UNITED STATES: CORPORATE PROFITS
- S. corporate profits have grown at a healthy pace but future expectations are that corporate growth will decline by 50%.
- The question is what will be the source of corporate profit growth considering more muted economic growth expectations?
- The growth rate in debt is low in the U.S. and corporate debt is expected to decrease over the next three years.
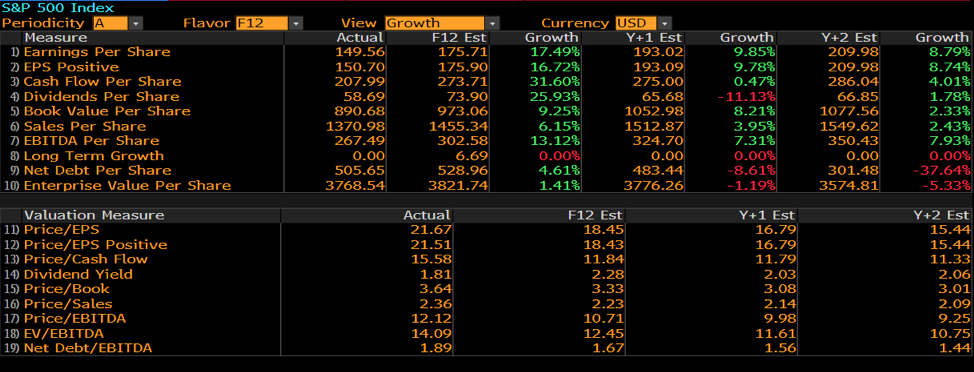
UNITED STATES: EQUITY VALUATIONS
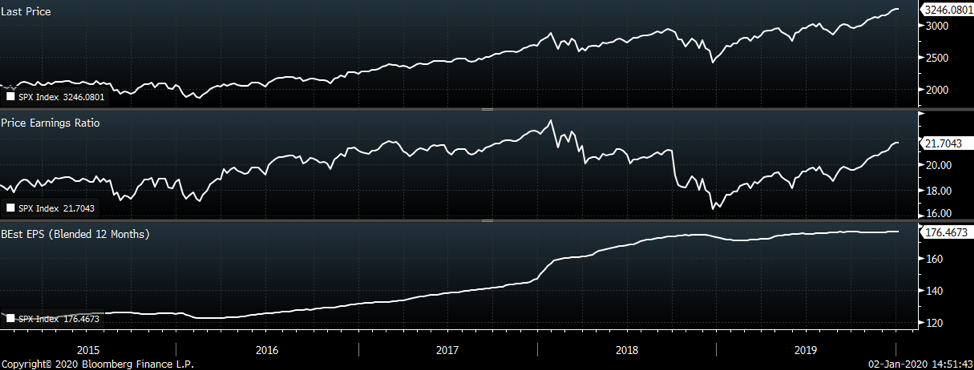
- The S&P 500’s price appreciation (top panel) has been remarkable since 2016 and has finally broken through the trading range experienced for the past two years.
- Earnings growth has been muted during the past two years, which does not square with the index’s price appreciation.
- Valuations (middle panel) are approaching the peak experienced in late 2017.
- In 2019, it seems that investors have ignored the “disconnect” between muted corporate growth and the general economic growth, which has led to a dramatic increase in the price/earnings ratio since late 2018.
UNITED STATES: MARKET LEADERSHIP
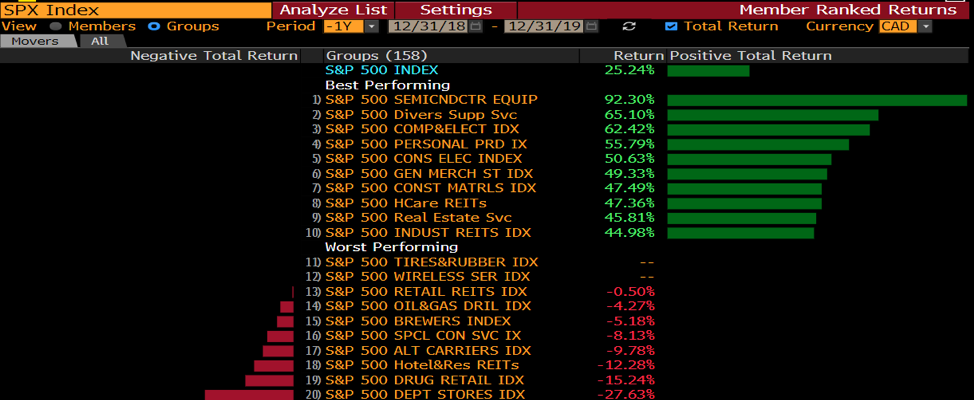
- There were very few weak sectors in the S&P 500 in 2019. The worst-performing industries were department stores and retail drugstores.
- The leading stocks this year were largely made up of semiconductor makers and companies that surprised investors by turning around their operations.

INTERNATIONAL MARKETS
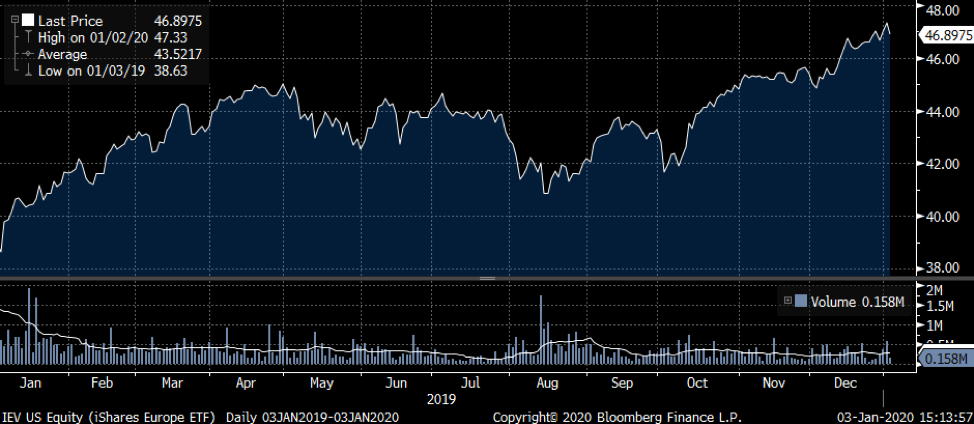
- The European markets (upper panel) had a great year in 2019. Despite the slightly weaker euro and a near-recession in Germany, the major markets on the Old Continent rallied in the fourth quarter.
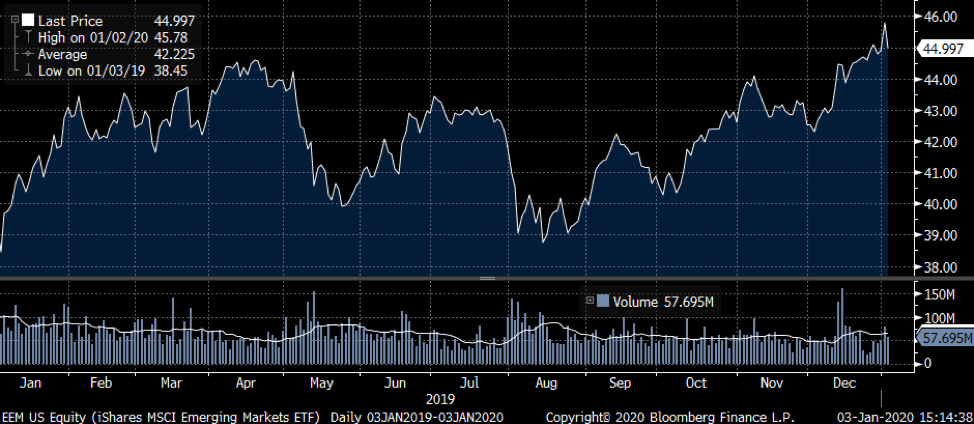
- Emerging markets (lower panel) also had a great close to the year. The anticipated resolution to some of the global tensions combined with a weaker U.S. dollar contributed to this late-year rally.
CURRENCIES
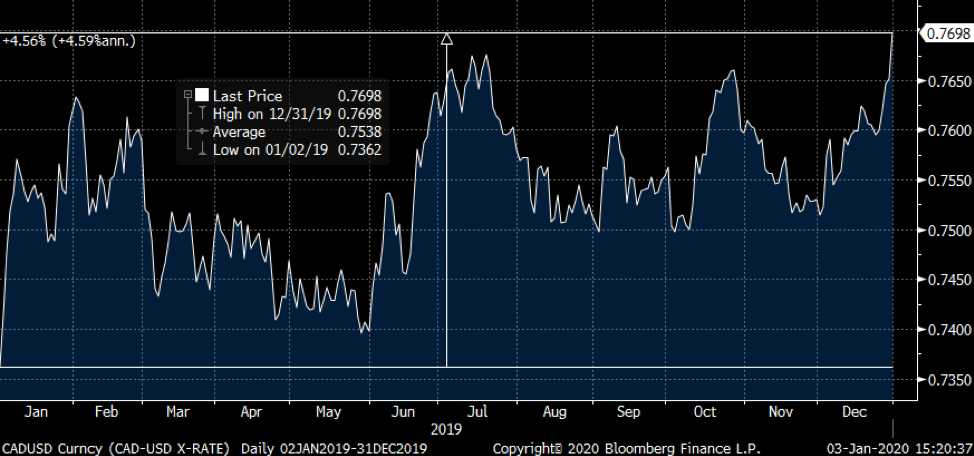
- The loonie (above) finished strongly in 2019: it closed the year having gained over 4%, albeit with some volatility.
- This increase was largely driven by the strength in oil prices.
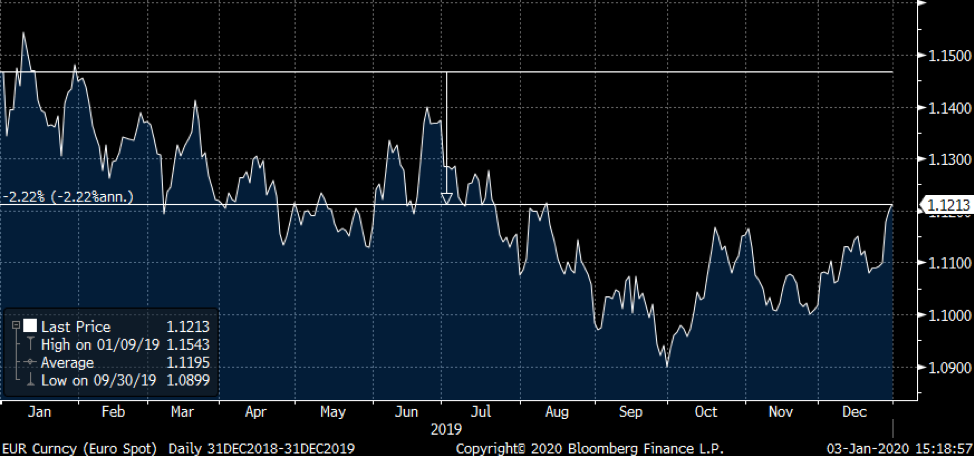
- The euro (above) stabilized during 2019. The long slide from a high of nearly US$1.7+ seems to have stopped. However, we are not ready to call a bottom on the currency just yet.
CANADA: INTEREST RATES
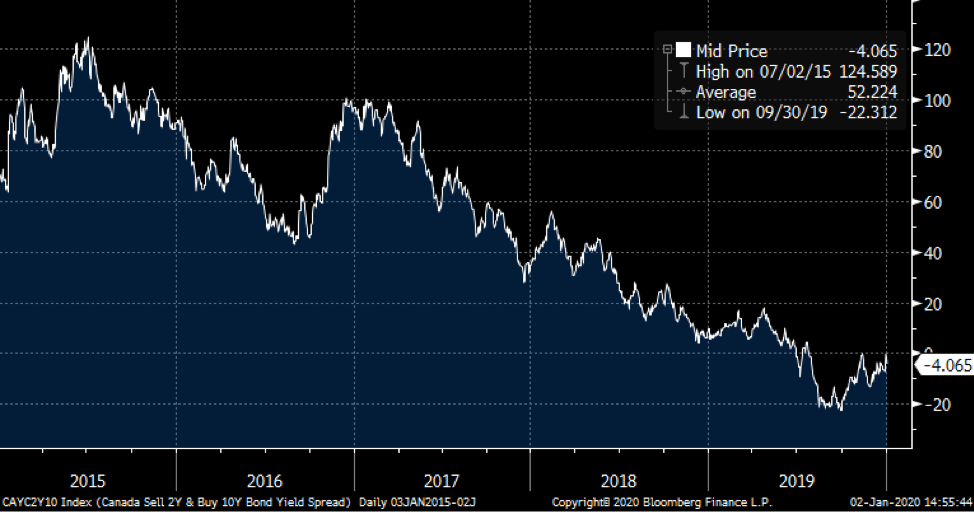
- The yield curve in Canada continues to invert. In other words, short-term (2-year) interest rates are higher than long-term (10-year) rates, as illustrated by the negative spreads shown above.
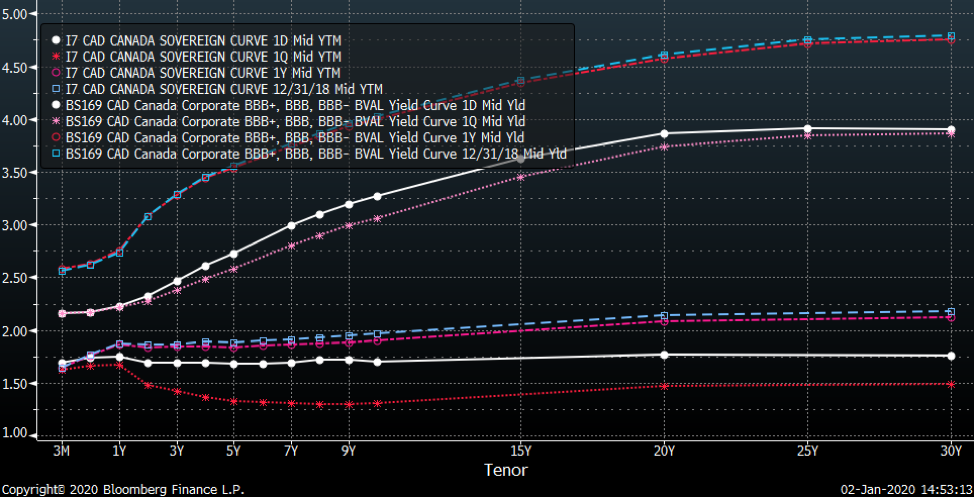
- Interestingly, interest rates or government bonds are substantially higher across all maturities when compared to last quarter’s close. However, interest rates are substantially lower than where they stood at this time last year.
UNITED STATES: INTEREST RATES
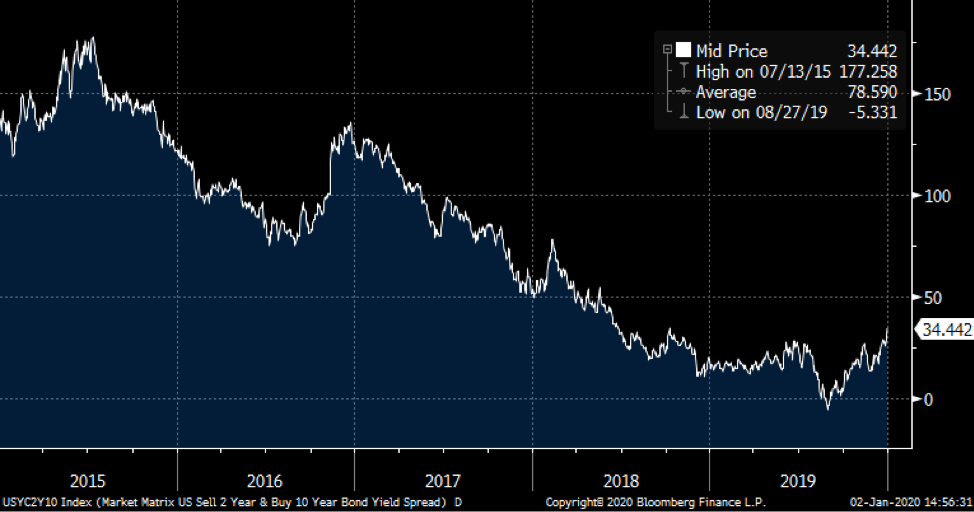
- The yield curve in the U.S. is no longer inverted, as illustrated by the interest rate differential between the 10-year (longer term) U.S. Government bonds and the shorter term (2-year) maturities. Oddly, the financial press that was raising a fuss over the yield inversion just a quarter ago seems not to have noticed that the situation has normalized. Our guess is that the adage that bad news sells more newspapers (or clicks, in today’s media) than good news is still true.
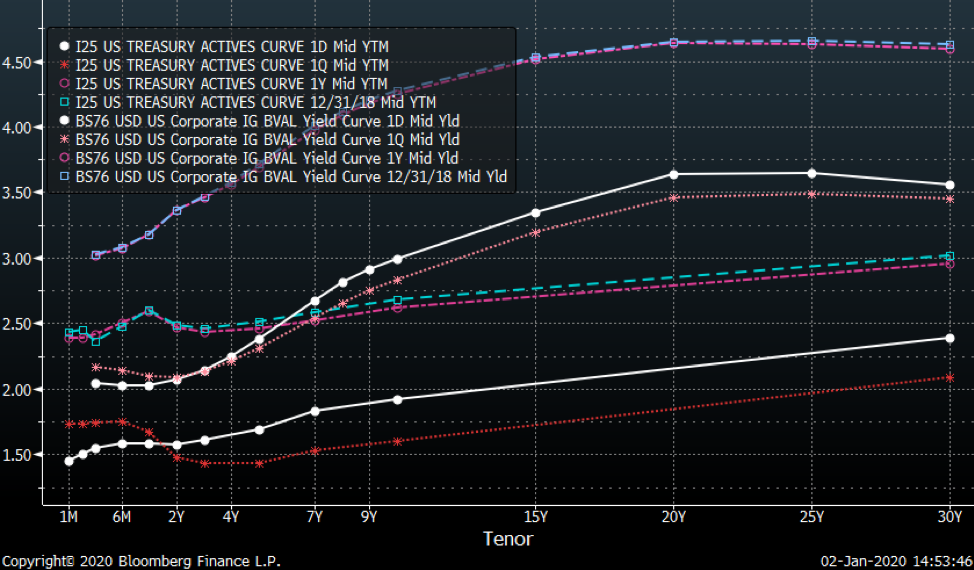
- Another development unique to the United States: the longer-term interest rates have increased dramatically compared to the previous quarter (white line compared to the red line) while the shorter term maturities saw their rates drop.
OPTIONS MARKET
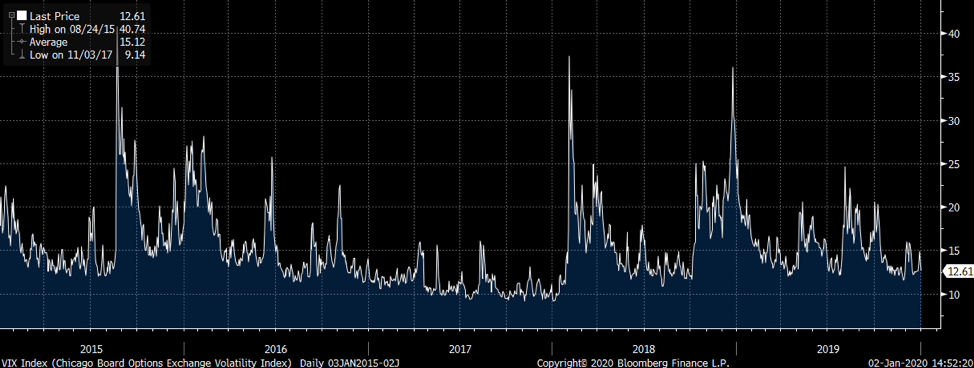
- The volatility measure (VIX index) for the S&P 500 index dropped in the second semester and spent most of the year below 15. Thankfully for option sellers, the VIX is near its ideal zone: neither too high nor too low. This was reflected with a good performance for our option-selling mandates.
MARKET ACTION LESSON
- Knowing what drives market action is essential. Stocks go up because either (a) underlying earnings grow, thereby increasing the business’s value, or (b) investors are willing to pay more for a dollar of earnings.
- Earnings (EPS, or earnings per share) can increase or decrease the value of a stock or index. In addition, valuation metrics (price/earnings or P/E multiple) can affect the value of a stock or index. These two factors can work together or against each other.
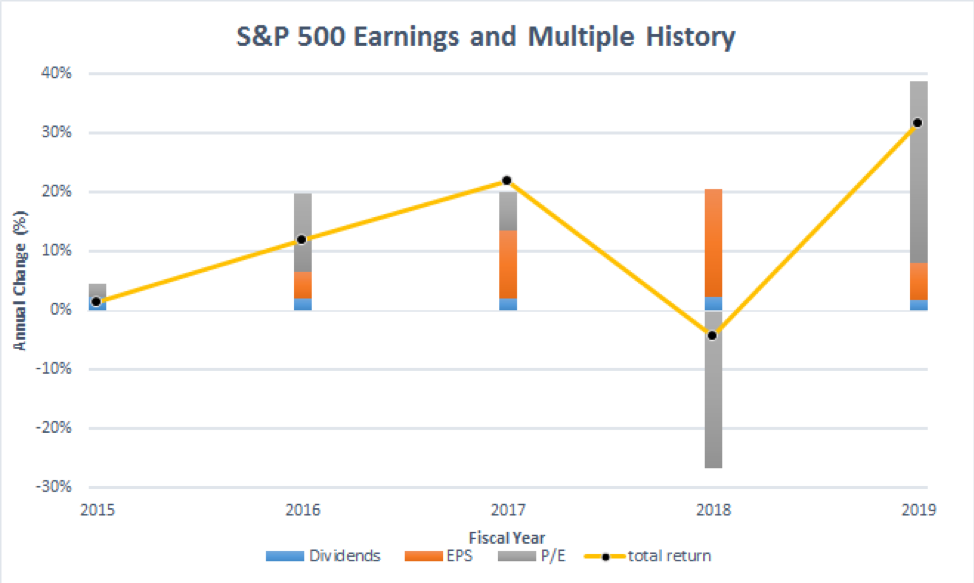
- The chart above illustrates the impact of valuation, earnings and dividends on the return of the S&P 500 index for the past five years. We can see that in 2018, the multiple (grey segment) contracted while earnings (orange segment) and dividends (blue segment) expanded. For 2019, the earnings multiple expanded dramatically, while earnings growth was much more muted. In other words, 2018 and 2019 were diametrically opposed in terms of performance drivers. The oft-cited quote that the market is a voting machine in the short-term is very much evident in this chart.
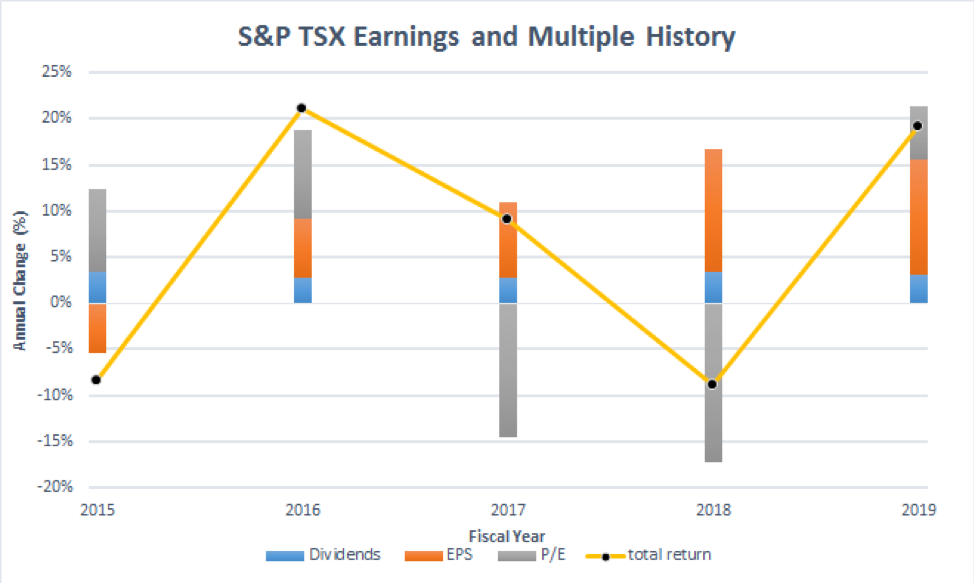
- The same chart for the Canadian market is shown below. The substantial earnings generated in Canada for 2018 and 2019 can be attributed to the rebound in the resource sector, specifically oil and gas producers. However, the earnings multiple’s expansion was much more muted in Canada than in the U.S. This chart helps to see that Canadian equity valuations as a whole are lower in Canada than in the U.S. The question is whether this discount is warranted.
CONCLUSION
- Despite markets being at all-time highs, we are always on the lookout for overlooked quality companies. For most investment mandates, we tended to raise cash by selling shares. The cash balances are now intentionally quite defensive and are at those levels by design.
- The plan is to deploy accumulated cash reserves by buying quality stocks when other investors worry about the news and the future. We are prepared to remain especially nimble and opportunistic this year.