
Summary
When one manages money professionally, what we are really hired to do is find and take advantage of investment opportunities. For existing clients, we portfolio managers tend to prefer a market that is trending up; it makes for nice statements and happy clients. However, since our firm is growing, thanks to new clients joining our ranks every month, and many of our clients are adding additional funds to their portfolios and reinvesting the income generated from the portfolios, a market pullback ever so often is welcomed as we can be take advantage of investment opportunities.
As an investor, owning quality companies with growing sales, sound finances and growing dividends is a proven long term investment strategy. However, we are all subject to behavioural habits; one of which is to extrapolate recent performance into future expectations.
So while opening your monthly statements has been a pleasant affair since the summer of 2011 which is the date of the last significant market drop, reinvesting new money or investment income has been becoming more challenging. When you have been managing investment as long as we have, we also know that a lack of volatility combined with a certain level of investor complacency is not the normal state of affairs.
If these opening lines makes it sound like we are cautious; we are. A wise man once said that successful investors are greedy when others are fearful and fearful when others are greedy. We are not necessarily preparing for another market meltdown, however, we are finding ourselves to be selling more positions than we are buying. A strong discipline can actually be a challenge to maintain when many of our competitors seemed to have forgotten the lessons from history.
Market Drivers
Exponent Investment Management Inc. does not rely on market pundits reading tea leaves in order to develop our investment thesis; we do our own research. We would like to share with you two items we focus on for our investment strategy.
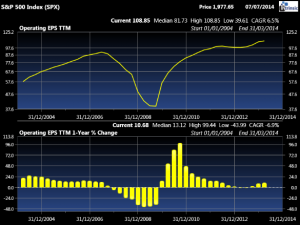
1. Earnings: When researching companies and studying markets, the first item we focus on are the earnings. If we look at the S&P 500 which is a proxy for the US market as illustrated on the left, we can see the earnings per share of the index for the past ten years. What is clear from the graph is that the index suffered a big dip during the past great recession and now we stand above the previous peak in earnings dating back to 2007
2. Valuations: The second step when researching stocks is to see what investors are paying for each dollar of earnings. When investors are jubilant, they will bid up each dollar of earnings. This earnings ratio is referred to as the Price Earnings or PE ratio. Currently the market is sitting well above the 10 year average, with a forward PE ratio of 16.2. The highest ratio we have seen in the past ten years is 17.4 with the ten-year mean of 14.6.
Our conclusion is that the current market is expensive, but not necessarily as expensive as it has ever been. Should earnings for the balance of the year be less than the expectations set by investors, we would probably witness a significant pullback in the market. Bottom line; it’s all about corporate earnings for the balance of 2014. If they do well, the market will do well. If they disappoint, so will the market.
U.S. Market
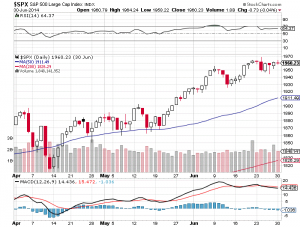
The US market, as illustrated by the S&P 500 is up 7.6% in CAD terms for the year. For the second quarter, the performance was 1.6% in CAD terms. This performance is attributable to earnings improvements AND investors bidding up these earnings by their willingness to pay a higher PE ratio.
As we can see for the chart of the S&P 500 illustrated on the left, the market effectively went up with few interruptions.
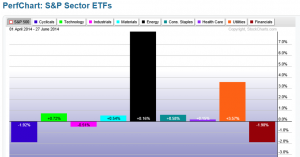
However, we wanted to know which sectors of the market drove the performance this quarter. The best way to illustrate this is by looking at the chart on the right. What we found is that the bulk of the market’s performance can be attributed to two sectors- utilities and energy stocks.
Canadian Market
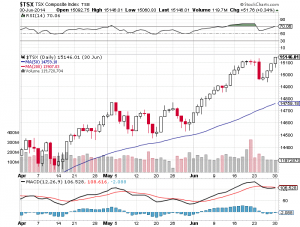
Canadian markets posted stellar returns so far this year. The TSX composite posted a total return of 12.9% for 2014 and 6.4% for the quarter. The Canadian market is unique given the fact that three sectors clearly dominate the market. Financials, Energy and Materials.
The Energy sector posted a return of 21% so far in 2014. Meanwhile, the Materials sector produced 16% in 2014 and the Financial sector posted a respectable return of 8.7%. The Energy sector clearly benefited from higher oil prices as we have all experienced at the gas station. Materials benefitted from a bounce back after a terrible 18 month stretch while the Financial sector benefited from a decline in interest rates.
Europe
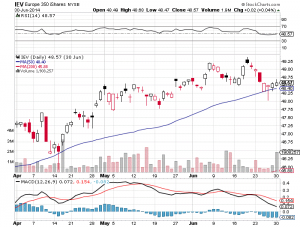
In Europe, as illustrated by the chart on the left produced profitable returns. The MSCI Europe Index posted a return of 3.9% in CAD terms. In fact, the Spanish market led all European bou
rses with a return of 10% in CAD terms.
European economies continue to be on the mend and the largest European companies continue to post growing sales and profits. While the rate of growth is still slower than we would like, valuations continue to be discounted compared to their U.S. based competitors.
What Moved the Markets?
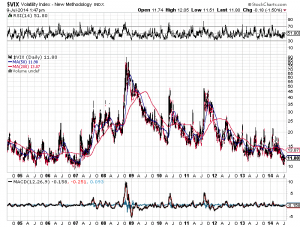
We actually do not have very much to report in terms of market movements. There is very little volatility in the current market place.
We cannot predict if the current low volatility is here to stay, or is in fact the normal state of affairs, but we do know that periods of low volatility precede periods of higher volatility and market angst. Please refer to the chart on the right as an illustration of the volatility index known as the VIX for the past ten years.
Interest Rates
Most investment values are predicated on interest rates because, quite simply, interest rates represent the cost of money at a particular moment in time. When interest rates are low, future income is worth more than when interest rates are high.
The Canadian Bond Market
All was quiet on the Canadian Bond market. The total return for the RBC DS Broad Composite Index was 4.8% for 2014. This follows the trend of lower interest rates for the year. For instance, we saw 5-Year Canadian Government Bonds yields moved 7% lower from 1.69% at the end of March to 1.57% at the end of June. Meanwhile, 10-Year Bonds issued by the Canadian Government moved down 8% from 2.45% to 2.26%. These lower rates benefited all of the interest rate sensitive investments: from bonds to banks and utility stocks.
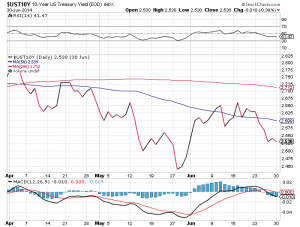
The U.S. Bond Market
We have charted on the left the 10-Year bond yield chart for the U.S. Government bonds. As you can see from the gra
ph, interest rates in the United States also fell 8% which translated into higher prices for bonds.
In short, lower interest rates helped the stock market post positive performance numbers in the U.S also.
Our Opinion
We continue to be cautious of the short term prospects for stocks. However, the medium and long term prospects do appear quite constructive given the positive economic momentum. The challenge for us is to find great investments at good prices. Valuations are not at the level where we would be worried about our current stock holdings. However, finding new investments in this environment is certainly more challenging that it was just a few years.