2014, the year of surprises…
This past year proved to be full of surprises. A year ago, the consensus market themes for 2014 were that (1) interest rates were going to rise; (2) the Chinese markets were in for a slowdown; and (3) the oil patch would be Canada’s economic leader. None of these predictions turned out to be true.
As humbling as 2014 was for many investment managers, predicting the future is part of our job, and no one can predict short-term market and economic movements with 20-20 accuracy.
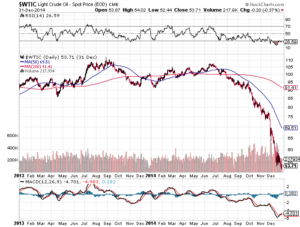
2014 was an unusual year in the Canadian market where the performance of the broad indices was carried by just a handful of stocks, very few of which would be considered market leaders. Falling oil and gas prices made the second half of the year particularly challenging—especially the fourth quarter. As you are certainly aware, the North American oil price, West Texas Intermediate or WTI fell to levels we haven’t seen in several years (See Figure 1).
Figure 1
Oil related stocks fell in lockstep with the oil price. Our energy holdings, which amounted to about 15 percent of the portfolio, nearly all fell 30 to 40 percent, cutting about 4 percent from the performance of the total portfolio. Fortunately, the rest of the holdings performed well enough to offset the loss from the energy sector and elevate the full portfolio to positive returns.
The U.S. Market posted another outstanding year, especially when converted to Canadian dollars. The gains were well dispersed and were supported by an economic recovery that is now entering its seventh year.
Meanwhile, global markets mostly muddled through a rocky 12 months, with geo-political tensions in Europe and the Middle East constraining still further the already tepid level of economic activity. Bond markets on both sides of the border posted positive returns, surprising most experts who had been predicting a rise in interest rates, which would have led to negative returns.
Market Drivers-U.S. Markets
The U.S Markets, as illustrated by the S&P500 index, posted a total return (including dividends) of 24.3% in CAD terms and 13.7% in USD terms. This performance added on to the return of 32.4% in 2013, 16% in 2012, and 2% in 2011.This streak of four, consecutive, positive years has led some pundits to believe that 2015 and possibly 2016 are ripe for a significant market reversal. We disagree. The markets are indeed expensive, but until we see earnings growth diminish, we believe U.S. equities will continue to post positive numbers. The U.S. is the only bright beacon in the current dim global economic environment.
The challenge, as always, will be about sector and security selection. Lower oil prices should have a positive effect on consumer related industries, as well as industries which have oil and oil-based inputs as their largest costs. Other sectors, such as heavy construction, steel, and oil and gas services could struggle over the next few years.
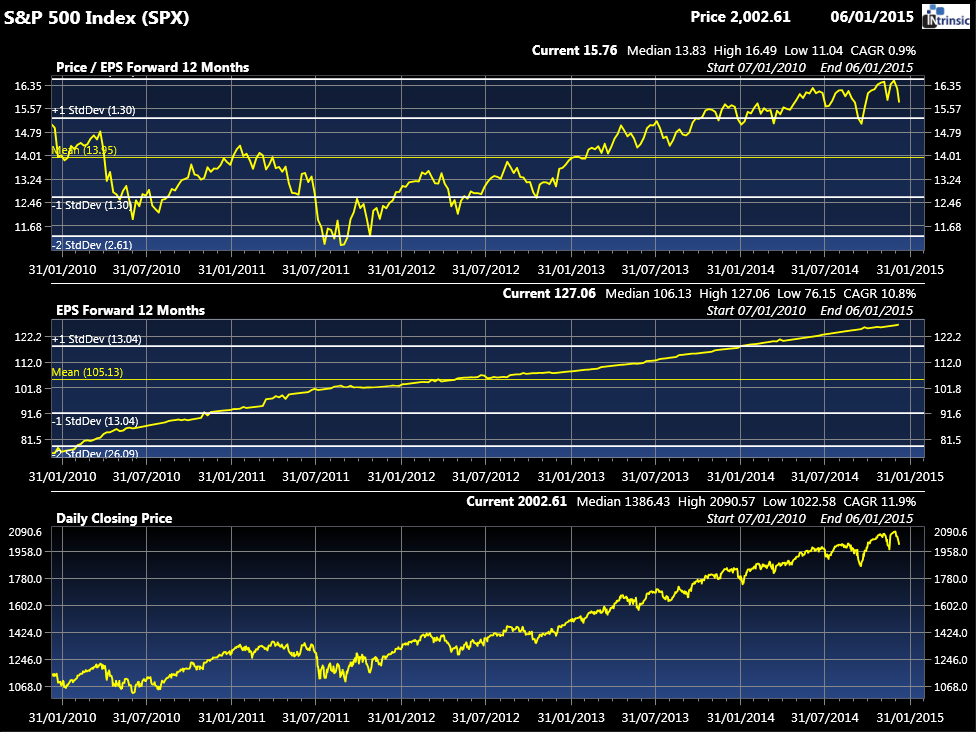
Figure 2
| For your portfolios, our focus will tilt toward companies which benefit from a strong U.S. economy and less towards U.S. multinationals which rely on global growth. Today’s economic environment is similar to the late ‘90s when low oil prices combined with a strong currency provided the U.S. economy with a very comfortable tail wind for many years. |
Figure 2 illustrates the Price / Earnings ratio of the S&P 500 index, the expected earnings for the index, and, finally the closing price. These five year charts paint a portrait of a typical recovery–P/E ratios trending higher, which signifies a growing risk appetite on the part of investors, and continued earnings growth. All these factors can lead to stock price appreciation.
Valuations
The valuation of the U.S. markets has certainly become more expensive. If we look at the trailing Price/Earnings ratio (P/E), the ten-year valuation high is a 17.2 and we are currently sitting at 15.8 while the ten year median is 14.6. In short, we are above the mean but below the highest point of the past decade, which means investors have become more complacent and willing to pay more for a dollar of earnings.
Earnings
On the earnings front, the story is more positive. Economic data point to higher economic activity and an improving employment situation in the United States, which should result in higher earnings for most U.S.-domiciled companies. Lower oil and gas prices tend to have a greater negative effect on the Canadian economy—which relies heavily on energy revenues—than they do on the broadly-diversified U.S. market where energy consumption continues to be high.
Risk Appetite
It is clear that investors are becoming bolder. We believe that the strong performance of the U.S. markets since the ’08-’09 crisis combined with the strength of the U.S. dollar has made the U.S. stock market an attractive alternative for foreign investors. The infusion of foreign investors is typically a late cycle phenomenon—and often a very powerful investment driver that should not be ignored. That’s why we believe that investor risk appetite for U.S. stocks will increase. While some pundits are predicting a market correction in the near term, history suggests that any significant correction would not take place until the market reaches a higher mark. We do, however, expect is a higher level of volatility than what we have been accustomed to these past few years.
Canadian Markets
In short, Canadian markets performed poorly in 2014. Much as in 2007, the performance of the market was driven by about a dozen stocks that had a significant downward impact. For instance, even though the broad S&P/TSX Index gained 1,011 points in 2014, the Oil Exploration and Production subsector lost 382 points on the year—punctuated by a 484-point decline in the fourth quarter. That, in a nutshell, explains a good portion of our underperformance this year.
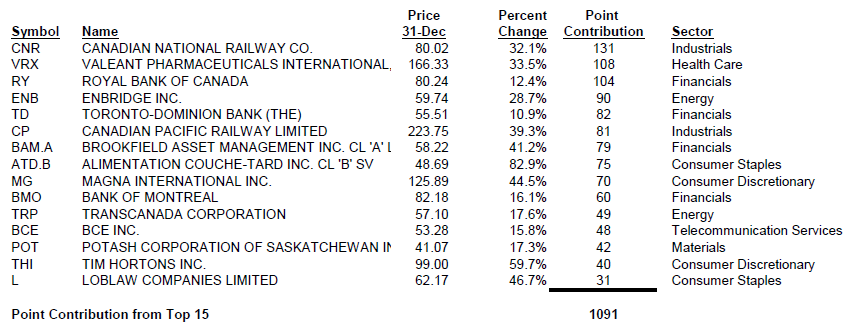
In fact, all of our portfolios are designed to own best of breed companies. Canada hosts some of the best global oil and gas producers. That’s why we own them—and it’s a home advantage we’ve been able to exploit in the past and have every expectation of benefiting from in the future. The same can be said for metal and gold producers. However, 2014 was an interesting year as the sectors that are not best of breed when viewed using a global lens performed well above expectations. For instance, presented below in Figure 3 is a list of the top 15 performing stocks of 2014 for the Canadian markets:
Portfolio management is about making investment choices. Many of the names above did not make their way into your portfolios because our research led us to the conclusion that they don’t have the long-term growth prospects of many of their global peers. For instance, Canadian companies operating in the telecommunication spaces or catering to consumers are not known as global leaders, and as such we have had a preference for owning these sectors in the international portion of your portfolios, where we believe the long-term potential is the greatest.
Figure 3
| One of the takeaways from 2014 for your humble investment management team is the corollary impact to the fact that the Canadian market is very small and concentrated in three areas (oil, mining and financial services). Since we have a global perspective, we have the luxury to compare the Canadian names with their global counterparts. However, most Canadian money managers do not have this advantage as their mandates force them to stay invested in Canada. |
The net result of this made-in-Canada situation is that stocks that would otherwise be ignored on the global stages are in fact bid up as they are purchased simply because they are not part of underperforming sectors. Since there are very few of these stocks, these few will experience very strong performance when Canadian money managers want to stay away from the oil & gas sector and the mining sector, which together represents nearly 40% of the Canadian market.
As those investment dollars shifted away from the oil & gas sector and into the remaining 60% of the market, that reallocation translated into hefty gains for a few select names. Much like compressing the end of a balloon, a slight application of pressure has a tremendous impact on the opposite end.
The fact that our approach is global one and allows your portfolios to be globally diversified means that in 2014, like 2007, our portfolios underperformed the overall Canadian market. While under-performance is something we do not relish, we see 2014 as a short-term aberration with little impact on the long-term performance of our strategy. We are willing to live with the inevitable short-term fluctuations to pursue our modus operandi—to invest in great global leaders that offer the best chance of outstanding long-term growth.
Foreign Markets
The U.S. markets are now considered the safest bet on the global investment scene. We are now almost six years past of the ‘08-09 market crash. The reason for the superior performance of the U.S. markets is the fact that the American economy has rebounded while most other economies have stagnated.
Figure 4
We are now witnessing a change. We now have a significantly more expensive U.S. dollar and a U.S. economy on much more solid footing. While we feel that the higher dollar will put American multinationals at a disadvantage relative to their European competitors, the companies catering to the domestic economy should see accelerating results.Before the economic crisis, one of the American economy’s pillars was the real estate sector. After the crisis, the American economy rebounded thanks to central bank intervention, political intervention, a lower dollar and lower labor costs, which made it especially profitable for U.S. based multinationals to export their wares and services abroad.
We would not be surprised to see a replay of what transpired during the late ‘90s, when low commodity prices and a strong dollar proved to be a boon for the U.S. domestic economy. Thus, we would expect the current accommodative monetary policies to continue to subside in the wake of stronger economic activity and improving employment results. It is important to remember that the U.S. is the world’s largest economy and thus its internal demand can act as its own economic engine.
Figure 5
The stronger U.S. currency is also benefiting the economy as it is acting as a buffer to inflation as imported goods and lower oil prices are benefiting consumers and manufacturers alike. We have begun to modify our portfolios to reflect this prevailing economic trend.
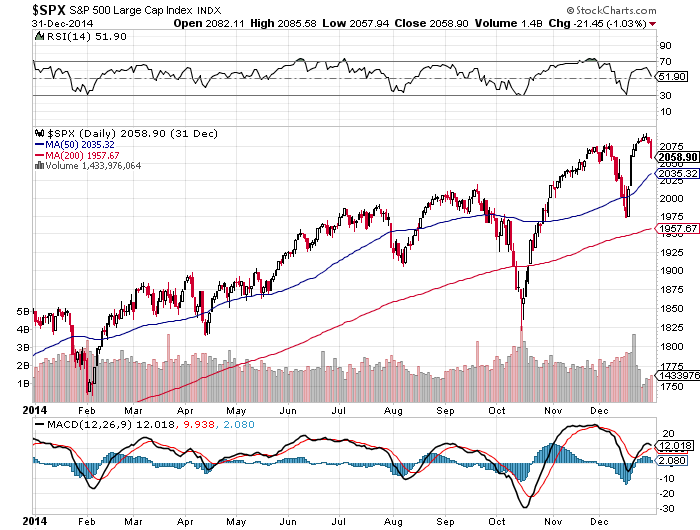
Illustrated in Figure 4 is the price action of the S&P 500 for the 2014 year.You will notice that the U.S. market also fell during the initial phase of the oil price collapse but quickly rebounded and held onto the gains.
We continue to favor owning some U.S. holdings even if we will be shifting the nature of these positions. When compared to the Canadian economy, we believe the U.S. is being poised for continued growth. Many pundits are calling for a pullback in the U.S. markets; given the valuations as we outline above in Figure 5. This could happen. Unless we see significantly disappointing economic results, the fact that the U.S. currency is appreciating as is the equity markets should continue to attract international investors.
Figure 6
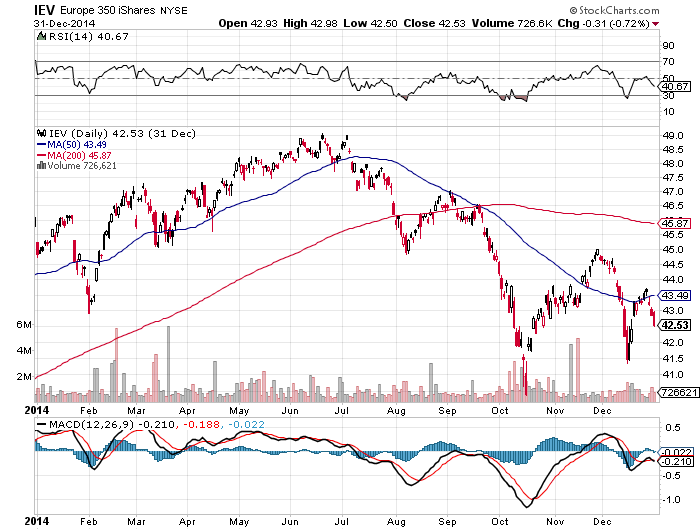
The European markets had a difficult time. Figure 6 shows you the 350 largest publically traded European companies in the Europe350 exchange traded fund.
For Canadians, the returns stemmed from the generous dividend of over 3.5% and the appreciation of the U.S. dollar as these European conglomerates trade in New York.
To recap the year of 2014, the beginning of the year saw some encouraging signs from both the European Central Bank and government policies that there was a sense of urgency in improving economic performance on the continent.
However, after the economic sanctions imposed on Russia for its actions in Ukraine, economic activity experienced another slow-down. Meanwhile, the ECB is increasing its actions and language which is having what we believe to be the desired effect; a lower currency.
A lower currency is usually the first step towards an economic recovery for an exporting economy. We are witnessing this occurrence in Europe. We have been looking at investing in the large commercial aircraft sector. As of the time of this writing, we have not made our final decision but the exercise illustrates the concept of currency depreciation. The sector is dominated by two very large manufacturers; Boeing (U.S.) and Airbus (France).
Currently the industry is enjoying great activity as new and expanding airlines are driving increased orders for the foreseeable future. The location of their head office does not have a significant impact on the quality of their products, yet it can have an impact on their ability to book orders. With a lower Euro, Airbus will have a distinct advantage booking orders as compared to Boeing, who reports to shareholders in U.S. dollars.
When we look at the valuation of both stocks, Airbus trades at 14.9X trailing earnings while Boeing trades at 17.6X trailing earnings. In short, the European conglomerate trades at a 17% discount to its U.S. competitor yet will benefit from a competitive advantage in the form of a lower currency. This situation was inverse five years ago.
So while our thesis of owning large European conglomerates has not been successful as of yet, their dividend profile and low valuations makes them a compelling investment for the long term investor. Going forward, a lower currency combined with lower energy costs and a Russian state that can only be described as in precarious financial condition and thus more open to dialogue should, in our opinion, prove to be excellent tonics for the European multinationals.
Bonds and Interest Rates
2014 surprised most investors when interest rates fell while most expected a rise. I am reminded of a common saying heard on most trading floors: when there is a universal consensus in one direction, the market usually does the opposite.
Canadian Long bonds returned 22% while the 10-year and 5-year returned 12% and 5% respectively. The U.S. Treasury market landscape was very similar, with 30-year, 10-year and 5-year returns of 30%, 11% and 2%, respectively. The path this year for interest rates was down without any interruption. The U.S. Government 10-year bond fell from a yield of 2.90% to 2.17% at the end of 2014, while in Canada, the 10-year Government bond fell from 2.4% to 1.8%.
Interest rates are important because they are used in the formula to value future cash flows. Thus, lower interest rates increase the future value of profits or dividends. Therefore, low rates are supportive of higher stock prices. Interest rate sensitive stocks such as utilities, real estate investment trusts and even bank stocks benefit greatly from lower interest rates. 2014 was no exception with the Canadian bank index posting a return of 13.5% despite diminishing profit, while the Real Estate index posted a 22.8% return despite flat sales and profit metrics.
One interesting point I would like to make is that interest rates in the U.S. are now higher than the ones in Canada as we illustrated earlier. Interest rates and equity markets can act as a negative feedback loop or a positive one. Higher interest rates combined with strong equity markets can attract foreign investors which in turn leads to a higher currency.
All of this is to say that in Canada, we seem to be witnessing a negative trend. Lower interest rates and volatile equity markets usually attract foreign investors suffering from significantly negative returns. The selloff in oil stocks coincided with a sell off in the Canadian dollar, leads to the retreat of foreign investors. With low oil prices, low gold prices, and low metal prices, why would you be interested in owning Canadian stocks?
Figure 7
Commodities and Currencies
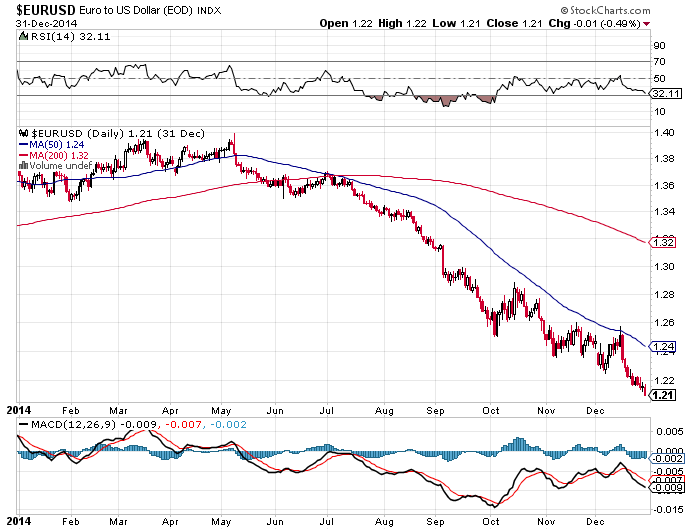
The Canadian currency continues its fall. In 2014, we moved from a loonie of $0.94USD to being worth $0.86USD. The days of parity to the USD date back to pre-2012. How quickly most of us forget.The strength of the relationship with the EURO is illustrated in Figure 7.Clearly, the USD is gaining ground against the EURO, which is only worth $1.21 USD compared with $1.37 at the beginning of 2014.
CBR Index
CRB stands for Commodity Research Bureau and tracks a basket of 19 commodities, including such random and unrelated commodities from orange Juice (the smallest component at 1%) to crude oil (the largest component at 23%). The CRB is a proxy for all commodities and the 2014 chart is depicted in Figure 8.
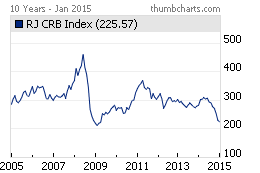
In fact, if we look at the 10-year chart (Figure 9), we see that CRB index is nearly at its lowest point since 2005. The significance of the low level can be interpreted many ways.
To be blunt, we are uncertain how to interpret it. But what can be said and explains why our portfolio contains more commodity stocks than one would expect—they are well below their historical valuation norms.
Figure 8
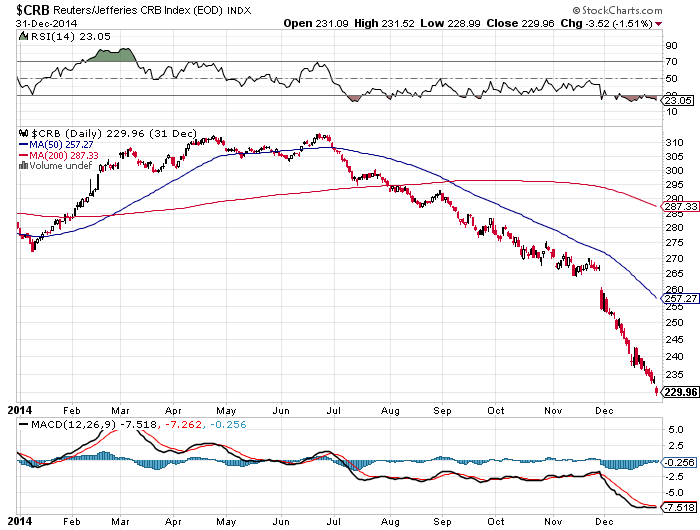
Figure 9
Commodity stocks are cyclical and offer some fantastic profit dynamics for the patient investor. However, they are not only volatile but unpredictable; one must accept the associated volatility. The CRB index clearly shows that commodities are unloved as the price level is at the lows of the past decade. Owning some of the best and most well capitalized in this space will eventually be a profitable venture.
Options
Our option portfolio fared better this year than our long only portfolio. For some that may be unfamiliar, we offer what we call an option overlay strategy to our clients who want higher income and more certain cash flows at the expense of higher potential capital returns.
Figure 10
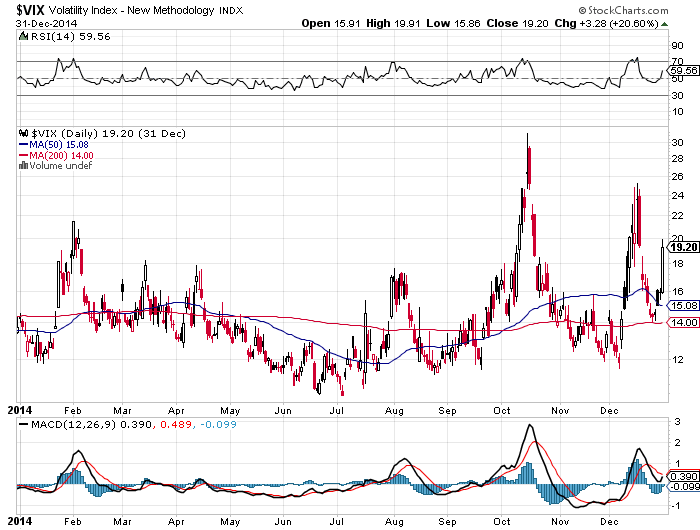
When markets are volatile, this strategy shines. But if markets are like 2013, where they simply go up in a straight line, this strategy can and will most probably underperform. The volatility index or VIX is illustrated in Figure 10. As you can see, the VIX was what I call dormant for the first 9 months of the year. I qualify dormant as an index level below 16.
A VIX level between 16 and 25 is ideal for our options strategy. When the VIX is above the 25 level (it can run all the way up to 90 as it did during the ‘08-’09 crisis), the management encounters the regular challenges as a conventional long only strategy: the markets are in a free fall.
Our Opinion
Our view on oil prices does need to be expanded upon. Here are two simple two points to remember:
First, low oil prices are cured by low oil prices. That is to say as the activity of drilling and producing oil becomes uneconomical, the activity is curtailed dramatically, leading to a shortage which, in turn, drives prices back up. However, there is usually a 6 to 9 month lag between curtailment and rising prices.
Second, there is no substitute for oil. Oil has a dependable demand which currently sits at 93 million barrels per day. Unlike coal, natural gas or uranium, oil has no substitute. The environmental movement is actively working towards creating oil substitutes, but for now, the global economy remains dependent on oil.
How dependent? When I read the 3rd quarter investor letter written by one of the deans of the investment management industry, Jeremy Grantham, I realized that oil prices cannot stay low for many years. The value of the modern economy is directly correlated to cheap forms of energy.
Centuries ago, it was land and people to work the land that was the most precious commodity…and we saw the rise and fall of many empires that strived to dominate this economic activity. Then came energy in the form of forests and coal. Again, empires rose and fell along with the ebbs and flow of these commodities. Finally, the modern economy is based on oil. From transportation to clothing to manufacturing, we all depend on oil. As Jeremy Grantham illustrated, a laborer with $15 of gasoline and a chainsaw can be 20 times more efficient than a team of axmen.
If the world consumes 93 million barrels a day, what has changed since June? Production is ramping up. Significant growth in shale oil in the US and our very own oil production in Canada is joined with new production from Libya and Iraq. Like all commodities, the change from surplus to shortfall is like a razor’s edge. Currently, the world is producing about 1 million barrels per day above the demand. That’s right, a 1% change in production can move a commodity 50%!
What has also changed is that the expectations, the most dreaded word for investors, changed. The growth in demand as the world’s economy is slowing has also been curtailed. The fear is that the over production will rise from a current 1million barrel to significantly more.
This explains why OPEC countries decided not to cut production. Since theirproduction did not change, why would they be expected to modify their output? There are other geo-political factors at play, some we are aware of, others we will never know.
What we do know is that oil finances unsavory characters like ISIS, as well as unpopular regimes like Russia, Venezuela and Iran. Letting oil prices fall is much cheaper than sending in the Marines and the 7th fleet…with similar crippling results. On this, the U.S. and the Saudis can agree.
What we do know is that the U.S. has seen it oil production move from 5 million barrels per day in 2008 to an expected 9 million barrels per day in 2015. The peak production in the early ‘70s was 10 Million barrels per day. This growth in production comes from a very specific reserve known as shale oil.
Shale formations are less than ideal formations. They are expensive to exploit and their reservoirs are depleted at a much faster rate. And since these formations are new, the depletion factors should still be considered best guess estimates. Currently formations give up about 50% of their oil in the first 24 months while conventional reserves give up about 25% in the first 24 months.
OPEC’s strategy is to let the U.S. pump oil, and since it is a finite resource in a less than ideal formation, they will eventually deplete it and some will go bankrupt trying to do so. Moreover, many of these shale companies are pumping despite the low prices as the shale boom was financed by stock sales AND more importantly, bond sales. So currently, many industry players are pumping oil at a loss in order to generate cash flows to cover interest payments.
We can criticize OPEC for many things, but managing oil prices is why they get up in the morning and is essential to their very survival. If OPEC is positioning itself to profit when production will come offline in the oil industry because of the current low prices, geo-political issues or technical challenges and the net result will be significantly higher oil prices, a wise decision would be to side with OPEC and take a similar approach—continue the current level of production—or even add to it.
So while 2014 was a disappointing year from a results point of view, I think it should also be viewed as a transition year. We moved from an era of high commodity prices to low commodity prices. We moved to having the U.S. be the economic engine, and we also have lower interest rates. We had international investors leave Canada in droves which led to a lower loonie and we have renewed international interest in U.S.-based assets.
We remind you that the philosophical foundation of the firm rests on investing in companies that have a history, an ability and a policy of rewarding shareholders through growing dividends, we apply this philosophy with a global lens; we call it Growth and Income with a Global Perspective. We invest in these quality companies when prices are attractive based on their long term ability to earn a profit, not necessarily next year’s. This means that we are invested in companies which may be unpopular and could remain so for much longer than we expect. But we continue to believe in our investment philosophy and we are confident that in the end, it will be rewarding for our clients.
The next step is to continue to research our current holdings to assure that they meet our disciplined criteria, and to continue to search for new leaders in great sectors in order to add to our performance. From the outside, the portfolios holdings may not change much, but on the inside we are constantly working on improving the portfolios.
Wishing you a prosperous 2015.