A good year filled with surprises
The year that just ended was one of constant surprises. The Trump election, the British referendum, the Broncos’ Super Bowl win… all the pundits learned humility! For me, 2016 brought back to mind Donald Rumsfeld, or rather a certain quote from the man as he was speaking about the Iraq war. I hasten to specify that it does not reflect on my political leanings or those of Exponent. That being said, here is what he said in substance:
There are known knowns. These are things we know that we know. There are known unknowns. That is to say, there are things that we know we don’t know. But there are also unknown unknowns – things we don’t know we don’t know.
When investing, the concept of “unknown unknowns” is critical. Most of the intellectual horsepower on Bay Street and Wall Street is focused on uncovering what is theoretically unknowable: the future.
At this time of year, I like to go back to what the pundits were predicting for the previous year. I’ll bet dollars to doughnuts that they were usually off, and often off by a country mile! The Brexit vote and the U.S. election are just two reminders of our inability to predict the future.
The S&P ended the year at 2,240, thanks to a rally that started on November 4th and produced a 7% return in a little over two months. The pundits had predicted anywhere between 2,100 and 2,300. The consensus was more or less on par. However, predictions were much more unreliable for oil (with a $70 consensus versus the low $50s currently), copper (consensus of $4,800 versus $5,500 currently) and our loonie (which was supposed to close out 2016 at $1.45 for every USD, but closed at $1.35).
The bottom line is that predictions make for great conversations but terrible inputs, when making long-term investment decisions.
So how does Exponent operate any differently? We work with what we can know: the “known knowns”, as per Mr. Rumsfeld’s phrase. In other words, we look at stock values in relation to their long-term historical averages and their relationships to other assets such as bonds.
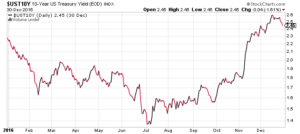
The U.S. bond investor at the close of 2016 would earn 2.46% in income every year for ten years, while the U.S. investor in the S&P 500 can expect to earn 4.72% (referred to as the earnings yield).
Please see the chart below for a visual reference of the yields.
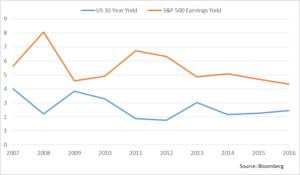
So while the difference is still positive by over 2.25%, meaning the equity holder is compensated an additional amount for the risk, this premium is not as profitable as it was in 2011. We have calculated this difference, and since 1929, the spread has been 2.48%. In short, the markets are not expensive relative to bonds – but neither are they a bargain.
In Europe, the earnings yield on the S&P 350 (largest European companies) is 5.5%, while the 10-year yield on the German government bond was 0.4% (that is not a typo) and 0.85% for the French government bonds at the end of 2016. In this case, the differential or premium equity investors receive twice what investors in the U.S. receive.
In Canada, the earnings yield on Canadian stocks was 5.98%, while yield on the Canadian government bond was 1.73% at the year’s end. By this metric, Canada is a better bargain, but the earnings yield in Canada has historically been higher than in the U.S.
4th Quarter 2016 Market Drivers
1. U.S. Markets
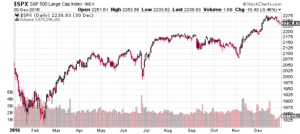
The U.S. markets were quite lucrative for investors. Volatility was present at the beginning of the year with a significant pull back. By mid-year, the index had bounced back and was essentially flat until the day after the U.S. election. From this date forward, the index rallied 7%. The final tally was a return of 8.8% in CAD and 12.0% in USD.
1.1 Valuations
Let’s look at the chart below to get an idea of the valuation of the U.S. market in general. As to the usual question – is it expensive or still a buy? – the chart shows that investors are still bidding up future earnings more than ever in the past five years. And they are doing this even while earnings for the 500 largest U.S. companies have stalled at the $120 per share level. In other words, the market is rising because it is getting more expensive. Our assessment is that investors are hopeful about the future.
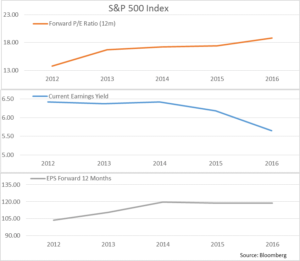
1.2 Earnings
The bottom portion of the above graph illustrates the expected earnings of the S&P 500 index. We are concerned about the plateauing of the earnings for the past 30 months or so in the U.S. Investors seem to believe that a change in presidency and its associated change in policy will spur economic growth which should flow to earnings growth. This remains to be seen.
1.3 Risk Appetite
The rise in the U.S. index has been largely on the back of multiple expansions, with the Energy and Financial sectors acting as powerhouses, strongly supported by Industrials, Materials, and Technology.
We are lukewarm on this market in terms of valuations, for the following reasons:
- Rising bond yields are deflating last quarter’s hot sectors, Utilities and Telecom;
- This quarter’s winning sectors are Energy and Financials, followed by Industrials in third place;
- Interest rates have gone up dramatically. However, it is unclear whether this is a sustainable change or simply a blip.
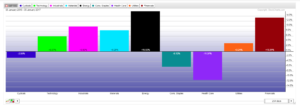
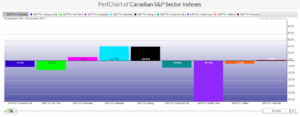
Nevertheless, we do see value in many sectors. The chart above shows the worst- and best-performing sectors in the index. Pharmaceuticals as well as the safer Consumer Staples have had a rough year, thereby making them a relative bargain.
2 Canadian Markets
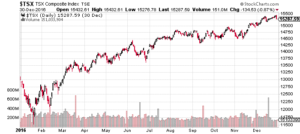
The Canadian market continued its rebound and is currently one of the best-performing markets in the developed world. This performance surprised us. The three main sectors of the Canadian economy all roared back to life!
- Energy and materials were the best performing sectors again this quarter.
- Higher interest rates helped the financial sector stocks. Insurers benefit from higher interest rates as do some of the core operations of the banks. For the banks, if rates were to rise too far, too fast, real estate and consumers would be negatively impacted.
- Our view is that bank stocks moved from expensive to very expensive while the rebound in oil and the commodity sector seemed to have been fuelled by outside geopolitical events rather than by an underlying growth in demand. This should spell caution.
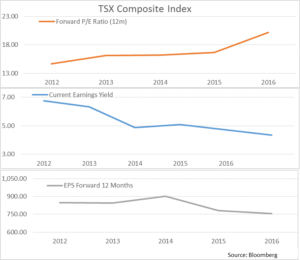
Above is our familiar look at the TSX from a fundamental level. The top pane of the chart displays the PE ratio (what investors are willing to pay for a dollar of earnings). The investment crowd is still willing to pay a higher than average multiple for earnings. Please note the earnings decline as well.
We, however, remain pessimistic on the Canadian economy. It does not present ideal conditions. Our dollar is currently too high to provide a meaningful advantage in terms of exports. In addition, while commodity prices have rebounded, that rebound represents neither a meaningful progress, nor a stable foundation for the economy. Like with all cycles, we believe the recent upward move in oil prices to be a counter-trend rally within a downward trend for our economy.
We remain focused on Canadian exporters or companies with meaningful non-Canadian operations. Not only do we expect the currency exchange rates to provide some relief, but we expect the economy in the U.S. and even Europe to post better results.
When we look at the middle pane, which illustrates the earnings yield of equity holders in Canada, and compare this valuation to Canadian bonds, we can see that the earnings yield that investors are receiving represents a premium over bonds, as the yield on a 10-year Government of Canada bond hovers around the 1.5% level. The trend does flatten out, which would indicate that either earnings must improve or prices must fall for future appreciation to continue. This being said, investors are acutely aware that, other than in stocks, there are simply no compelling returns available in the market. Canadian investors are stuck between a rock and hard place.
One of the hottest sectors in Canada was banking, and we were not heavily invested in this part of the stock market. Why? Because we continue to believe that this sector is expensive. The charts below illustrate how the Canadian bank stocks have gone from expensive to even more expensive.
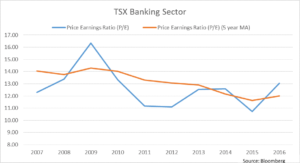
Above, we have the TSX banking sector’s price/earnings ratio (what investors are willing to pay for a dollar of earnings) in blue, and the five-year moving average of the ratio in orange. In short, the multiples are above their five-year averages – and during what we would qualify as a softening economy.
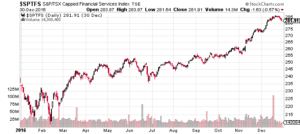
To summarize the Canadian market’s performance, two sectors carried the day: materials (metals and mining) and energy. These two sectors nearly doubled the performance of the overall index of 21%. The banking sector kept up with the market, but barely.
When we look at the Canadian financial sector directly (below), we can see that it had a tremendous two-month rally of 8% starting in November.
3 Foreign Markets
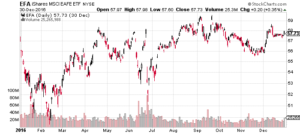
Above is the Morgan Stanley index that represents Europe, Australia and the Far East. The trend for the year was flat but with much variation, in particular during the first part of the year through August.
- The higher USD is still causing a problem for many Asian economies because their commodity input costs are priced in this currency. Also many commodity prices rose in the back half of 2016.
- We are still concerned that many companies and governments have issued debt in USD. As the greenback marched forward in 2016, interest payments in local currencies rose in step with it. Those higher payments can be a drag on these economies. The more they pay in interest, the less they can contribute to the global economy.
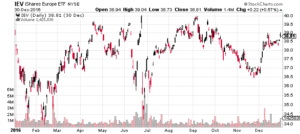
As the above chart illustrates, European equities when converted in USD moved forward this quarter. The number for the year is still negative, but that is largely attributable to the appreciation of the USD versus the euro.
- European multinationals are at an advantage in this environment: the low currency will help drive their sales and competitiveness. While this will probably not be translated into higher prices right away, their long-term health is ensured by this currency advantage.
- Many of these multinationals will not see their businesses materially impacted by the Brexit vote. Currently, their prices have sold off inasmuch as all European stock prices have fallen. We still believe these stocks represent tremendous value.
4 Bonds and Interest Rates
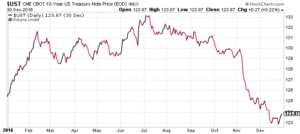
The yields in the second half of 2016 rose in a historical fashion. Rates moved from 1.4% in July to nearly 2.6% in less than six months. This change in yield corresponded to a fall in price of 8%. The chart below illustrates the change in prices of the U.S. government 10-year bond.
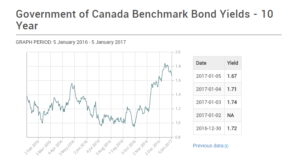
In Canada, we had much the same story on the 10-year government bonds. Yields troughed in the summer and rose dramatically after the U.S. election.
As we stated earlier, banks and insurance companies benefited from this rise in interest rates. However, it remains uncertain whether these higher rates are really here to stay. So far, mortgage rates have crept up both in Canada and the U.S. We will see if these changes in interest rates translate into lasting effects on these economies.
5 Options
The following VIX chart measures the volatility of the S&P 500 on 30-day rolling periods.
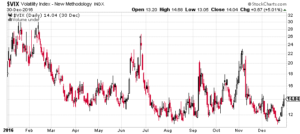
A few remarks:
- Volatility spiked prior to the election and subsequently melted down to below 12. (Whenever the VIX rises above 20 or 25, it is an indication that investors are more fearful than usual. A VIX of 15 or less indicated a lack of fear on the part of investors.)
- Our strategy aims at converting market volatility into tax-advantageous income by selling options and thus collecting option premiums. The higher the volatility, the higher the option premium we collect.
- When the VIX is above 16 is when we see better performance from the option accounts relative to our conventional accounts. Pretty much every quarter of the year represented ideal conditions for our conservative option strategies.
6 Our Opinion
We remain cautiously optimistic. Our risk controls revolve about being cognizant of valuations. If stocks reach and surpass prices that our research demonstrates to be above their fair value, we will sell them and look for better opportunities.
On the bright side, we have seen pockets of value. Giddy investors have punished, and will continue to punish, stocks that disappoint them in terms of results. In many cases, they are overreacting. It is in these instances that we would consider ourselves interested as potential buyers. Examples of that have been our recent purchases in Walt Disney Co and North West Company.
We continue to monitor the headwinds and will not hesitate to raise cash as our valuation targets are met. Conversely, we will be patient with our investment to ensure that our purchases are done at attractive prices. We do expect some larger-than-usual cash balances as we move through this process.
In closing, and to return to politics, here is an interesting fact about American election results and stock performance: one study suggests that the performance of the U.S. stock market is negatively impacted by a change in government when the new party controls the Oval Office, the House of Representatives and the Senate. Food for thought, and an incentive to remain very alert, as more high-quality bargains will no doubt emerge during the following quarters.