
A year of surprises despite calm winds
The year that just ended was a very interesting one, largely defined by unexpected electoral results. Messrs. Macron and Trump won their respective elections, and both caused jaws to drop during their first year in office. Without making a political statement, the former surprised most by his classic statesmanship and resolve despite his lack of experience. The latter exhibited an eccentric and unique kind of statesmanship that was even more pronounced than advertised.
Of note this quarter, and developed in detail within this market update:
- Canadian markets were friendly to investors. The financial sector continued its upward trajectory while some commodities, including oil and certain metals, saw significant gains.
- Returns were surprisingly strong in the U.S.and European markets.
- Changes in the yield curve are presenting themselves in the bond markets.
- Options markets remains subdued as there have not been any bouts of market gyrations.
Check out what’s new or, for a “brass tacks” summary, please feel free to jump to the conclusion.
In Exponent news, our team continues to grow! We have had the pleasure of having Eliott Einarson build on our success in Winnipeg.
Marie Auclair joined us in the fall and has brilliantly taken over the client service responsibilities, thus allowing Priyanka to devote more time to trading, compliance and associate portfolio management duties.
As always, we are thankful for the health of our business, as it is a reflection of the support we have received from many of you in the way of referrals and insight in how to improve our service.
Canadian Market
The Canadian financial sector continued its upward trajectory while some commodities, including oil and certain metals, saw significant gains. Housing and consumer debt levels continue to threaten while public policy and fiscal trends veered dramatically to a more populist tone to the detriment of the often cited 1%. It remains to be seen how these policy shifts will affect the overall economic health of Canada.
However, investor expectations, are bullish for Canada. Earnings per share (item 1) are expected to grow 21% in the next twelve months and to taper down to 10% and 4% in subsequent years. This earnings growth is thanks to a complete reversal in oil prices as well as other commodity prices as the world’s economy is growing nicely. This growth is in turn fuelling demand for some of the commodities we produce here in Canada.
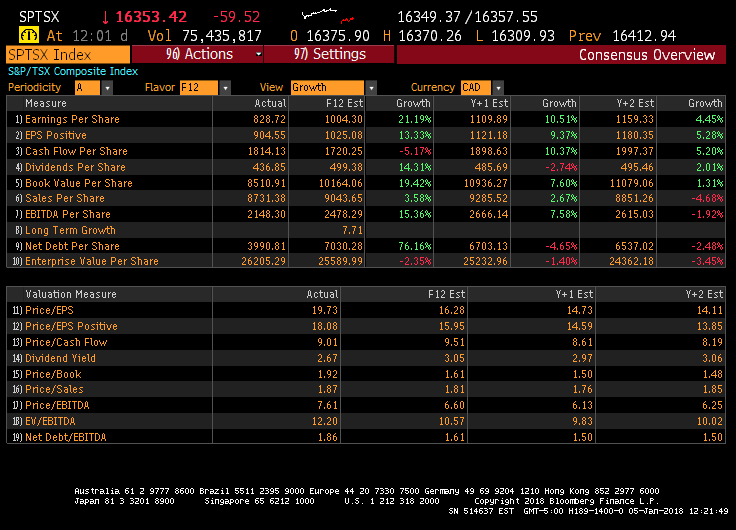
To get a clearer picture on whether the market is expensive or not, let us now look at prices relative to earnings.
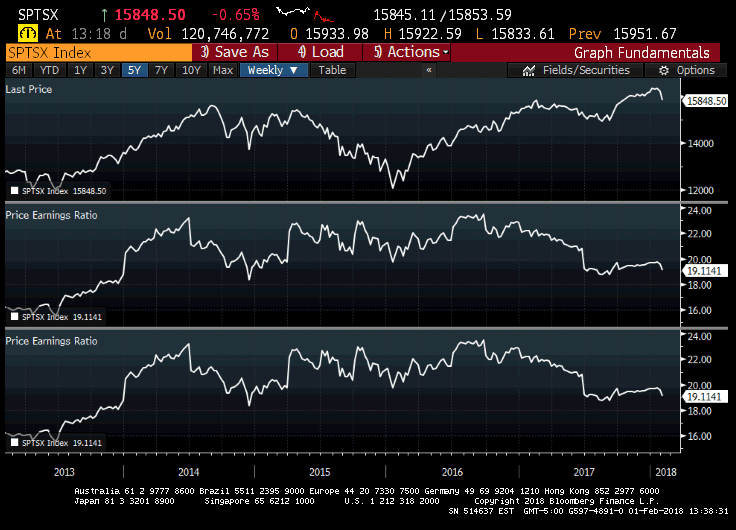
The recovery in earnings (bottom pane) has been the story of 2017. Should global growth continue, commodities will continue their upward trend. The top pane charts the price of the S&P/TSX Composite Index for the past five years. We are finally making new highs in Canada from the previous peak in 2015. Because of this earnings growth, the price that investors are paying for each dollar of earnings (Price/Earnings Ratio, middle pane) is quite attractive. If the earnings growth holds, the Canadian market is actually quite interesting from a valuation perspective.

The above chart illustrates the behaviour of the S&P/TSX Composite Index since the beginning of the year. The returns were negative up until September. The performance of the S&P/TSX Composite total return for 2017 was 9.1%, with a 4.5% return for the fourth quarter.
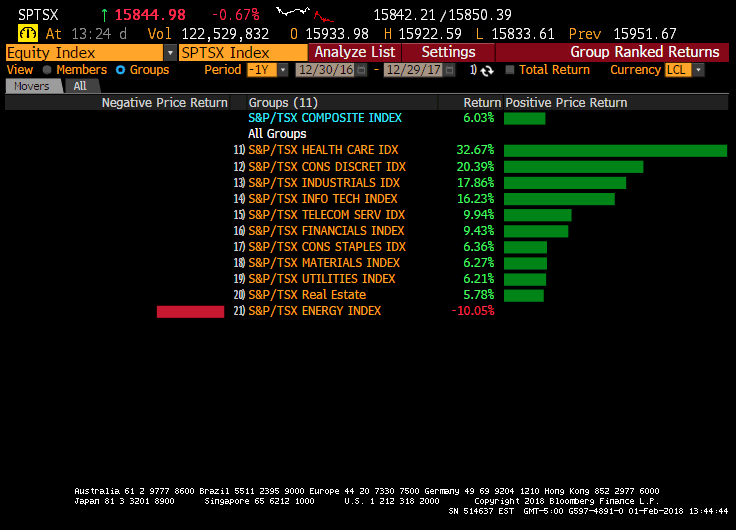
In the chart above, we have the sectors that comprise the Canadian market. Healthcare, consumer discretionary consumption as well as industrials produced the best returns in Canada in 2017. In fact, there was only one negative performing sector this year – energy –, which is a rare occurrence.
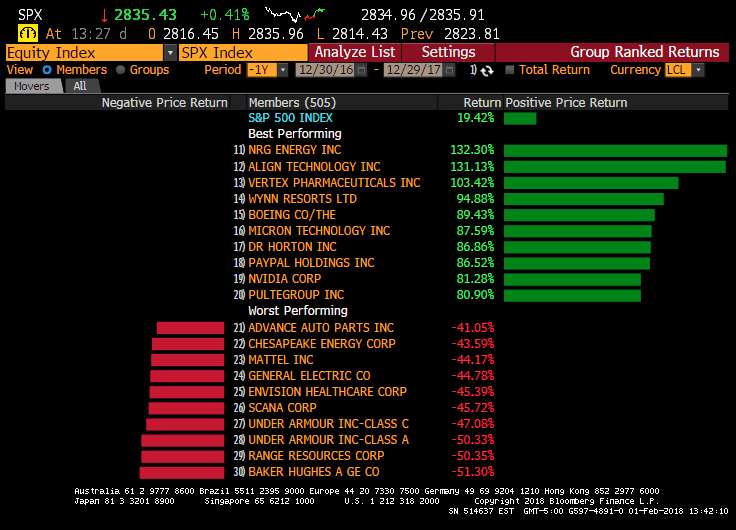
In the following table, we have highlighted the best and worst-performing stocks for the year on the Toronto Stock Market.
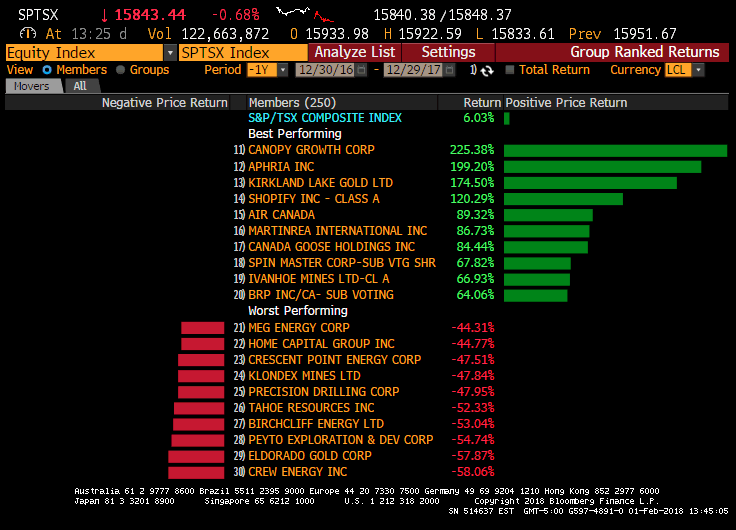
The top performers in Canada this year were speculative names. Companies that did not exist just a few years ago (or are staging a comeback after going bankrupt) dominated the top five. In fact, the best-performing companies belong to a segment that did not exist a few years ago: cannabis stocks. Conversely, the weakest performances were largely due to the oil and gas sector. What is most peculiar is that oil prices rebounded in 2017, but oil stocks diverge from this trend. The important question is: are stocks lagging the commodity or are they leading it?
U.S. Markets
The U.S. market had a very good year. Our American selections have equally done well. Even more interesting, despite our propensity to avoid what we viewed as the overheated sectors that have carried the indices, we have kept the pace. In short, we have delivered good performance with less risk. However, this was not without some white knuckles. In most conventional mandates, we focused on buying stocks in the retail sector. While we bought them cheap, we did not buy them at their cheapest, and we bought them a little early – so they kept falling, before catching a bottom in the fourth quarter and rebounding solidly to generate positive performance. The same can be said for the food producers (think peanut butter and breakfast cereals) that were on sale a few months ago.
Expectations of continued earnings and price growth
This is reflected in the analysts’ consensus for the S&P 500 Index, shown below. In particular, earnings per share (item 1) are expected to grow by an impressive 23% over the next 12 months, by 9% in 2019, and by 12% in 2012These estimates have been ratcheted up compared to last quarter’s predictions.
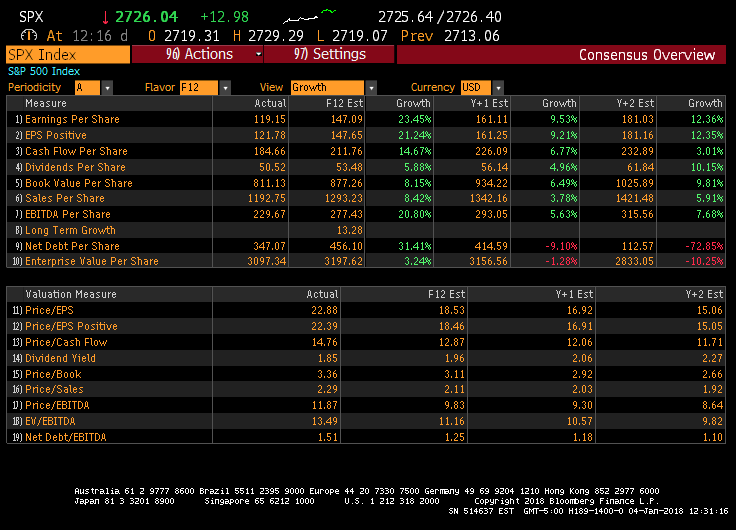
In short, strong growth is expected for the U.S. economy, and this growth is currently “priced into” the current stock quotations. If such growth comes in as planned, all will be well. However, if it stumbles, then these current quotations are on the high side.
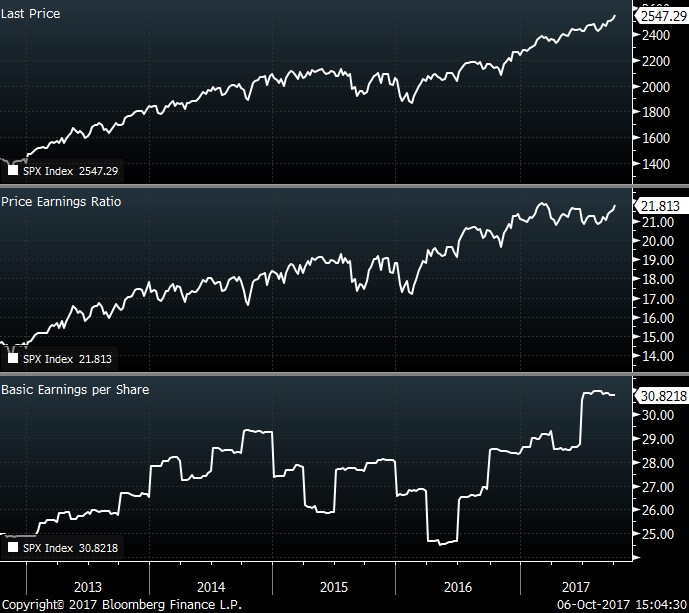
Charting the current situation
Below is our beloved three pane chart. The five-year evolution of the S&P 500 Index is charted. The second pane charts the price of the index divided by its earnings, the famous P/E ratio. The bottom pane depicts the growth of the index earnings. The conclusion remains that earnings have grown, but the bulk of the price appreciation has come from the P/E multiple expanding from 14 to 22 times. Investors are bidding up each dollar of earnings by more and more. Where investors paid about 15 times the expected earnings in 2013, they are now willing to shell out almost 22 times the expected earnings, or 50% more. Fear has changed into greed.
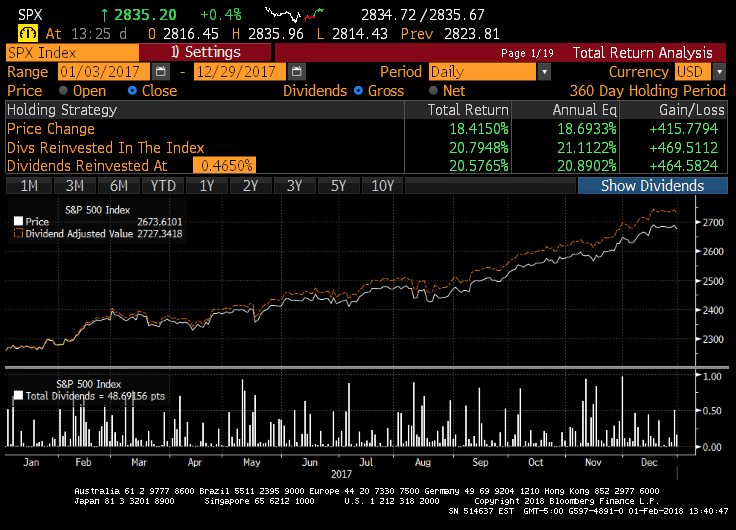
In the chart below, the white line shows the path taken by the price of the U.S. index since the beginning of the year: a narrow one, steadily going up to the top right quadrant, with very little in the way of drawdowns. The red line illustrates the impact of reinvested dividends, called total return, which is especially relevant to us, here at Exponent, as we focus on dividend-paying stocks. The total return in USD was 21.8% (13.9% in CAD terms) for the year, and 6.6% (7.5% in CAD terms) for the quarter. In fact, this year is the first in many that did not produce one negative month.
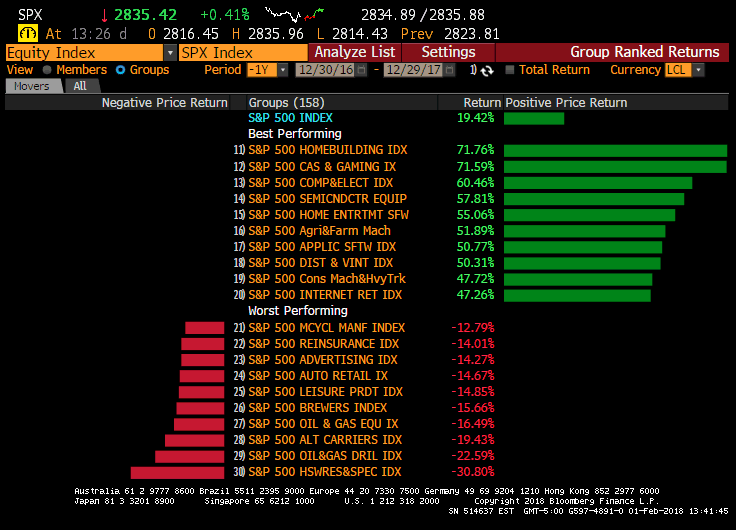
Some sectors of the S&P 500 have been very strong. In fact, the highest-risk sectors were the stars of the year. Casino operators, homebuilders as well as semiconductors were groups investors most coveted. Meanwhile, houseware-makers, oil and gas-related names, and such boring yet stable sectors as breweries and auto parts retailers were shunned.
International Markets
Europe continues to perform well. The IEV ETF, which represents the large-cap, dividend-paying names, has a 22% return.
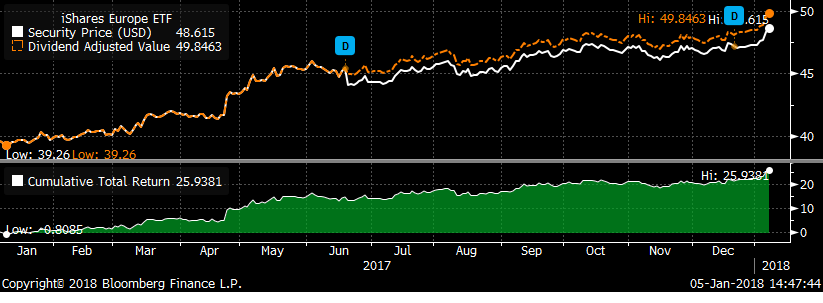
In fact, when we look at the performance attribution of the European market, every single sector has a positive return so far in 2017. We have focused our attention to the Consumer Staples and Health Care names based in Europe. The Euro rebounded in 2017. Investors benefited from a rising stock market AND a rising currency.
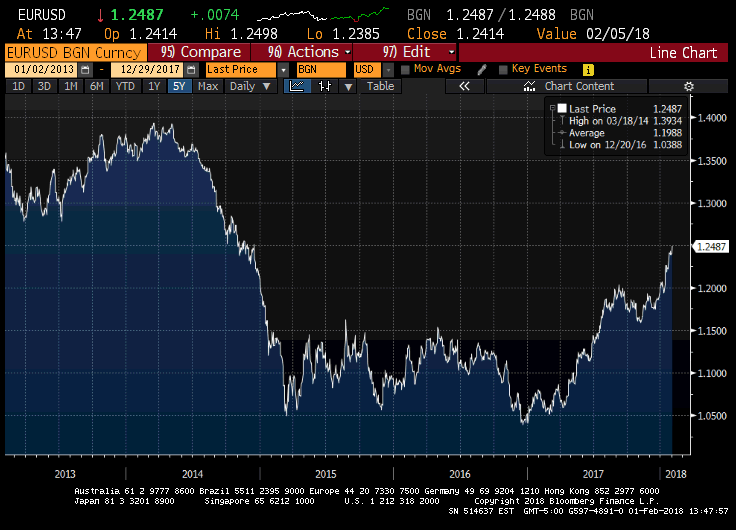
For Canadian investors, the Loonie’s rise Vs. the USD mitigated some of the positive performance.
Bonds and Interest Rates
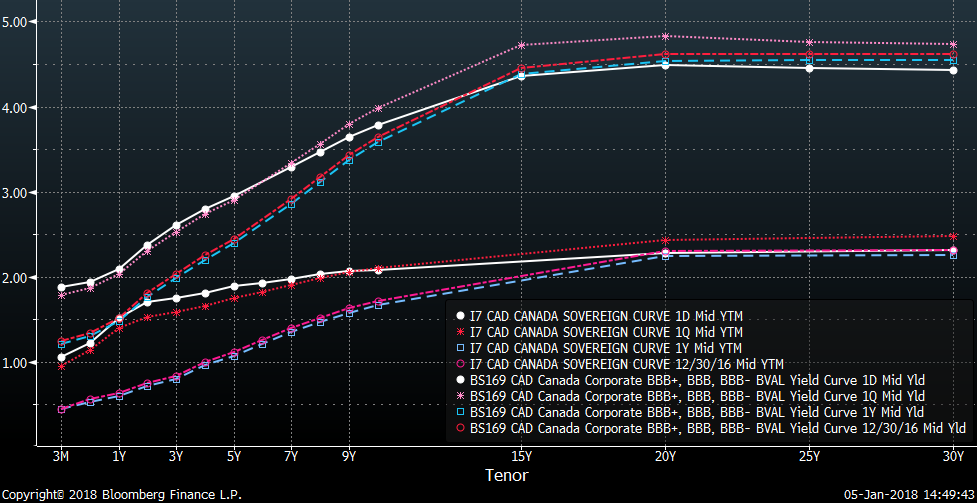
Bonds are one of the most fundamental asset classes, yet many investors dismiss them as “boring”. We have two new charts for you to review. The first covers the Canadian bond market while the second covers the U.S. bond market.
For each chart, you will see two sets of four lines. These lines represent the yield curve at different time intervals. Studying yield curves can provide some insightful information. I would like the reader to focus on both the shapeand the change of the shape of the curve. The top set of lines represents the corporate sector, while the bottom set charts the federal government bonds.
If we look at Canada’s chart first, we can see the following:
- Interest rates for the short maturities rose faster than the longer-dated maturities.
- Interest rates for longer maturities actually fell for the corporate sector.
- We are witnessing what is referred to as a flattening yield curve.
Let’s look at the chart:
Remember that as yields or interest rates rise, bond prices fall. Bond investors lose in a rising rate scenario.
Let’s look at the yield curve in the U.S.:
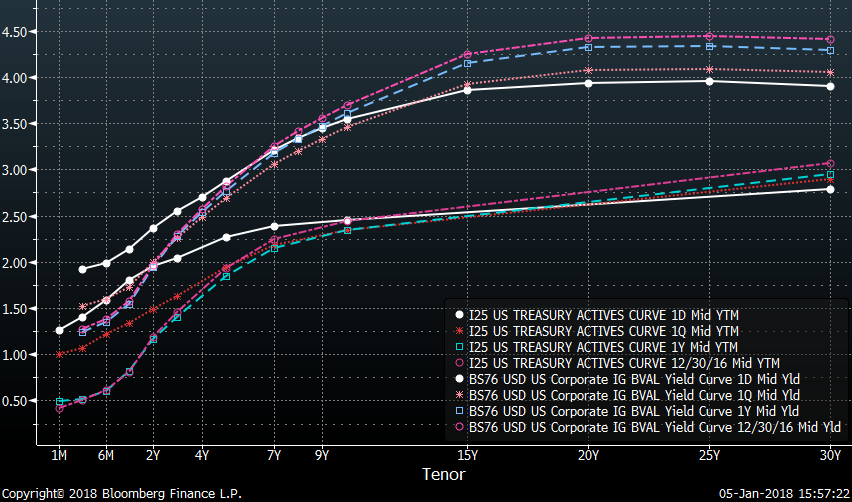
The flattening of the yield curve is even more pronounced in the United States. Moreover, corporate bond investors are receiving very little additional return for the added risk inherent in corporate bonds. This is an interesting situation. In summary, long-dated interest rates fell while short-dated interest rates rose.
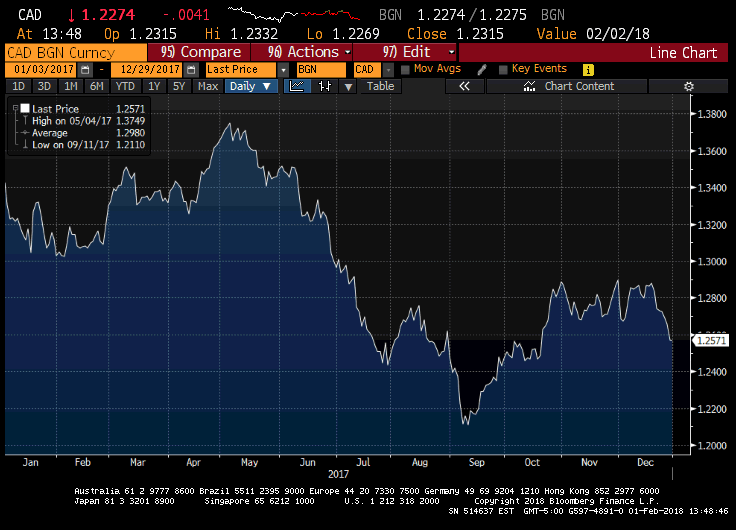
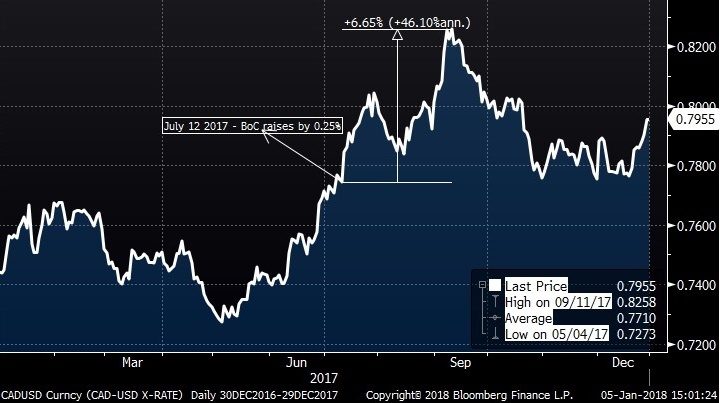
On the currency side, we saw the Bank of Canada July 12 announcement add nearly 7% to our beloved loonie in six weeks. We saw most of this gain evaporate during the major part of the fourth quarter. During the last few weeks of December, the loonie rallied and it continues on this path as of the time of this writing. Commodities and interest rates will lead the way for our loonie.
Options
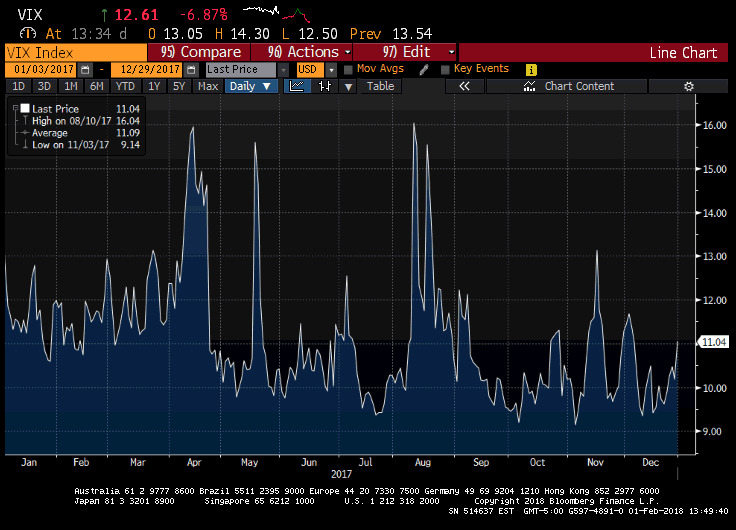
Volatiliy continues to be below historical norms. Rising markets combined with the popular use of various ways to sell volatility by way of option sales and other means translate into continued downward pressure on markets. The former is temporary while the other is much more secular in nature. Our option strategies have seen their performance suffer because of these factors. The currency pressures have also mitigated our Canadian dollar published performance. However, the preferential treatment of the option sales combined with the regular cash flow generation continue to serve the clients who are looking to improve their monthly cash flow generation in a tax efficient manner.
What’s New: Chart of the Week
We have many new communication initiatives in store for you this year. The first is what we are calling the chart of the week. We come across some very interesting charts as part of our research efforts. We will share one of these every week and explain some of the ramifications.
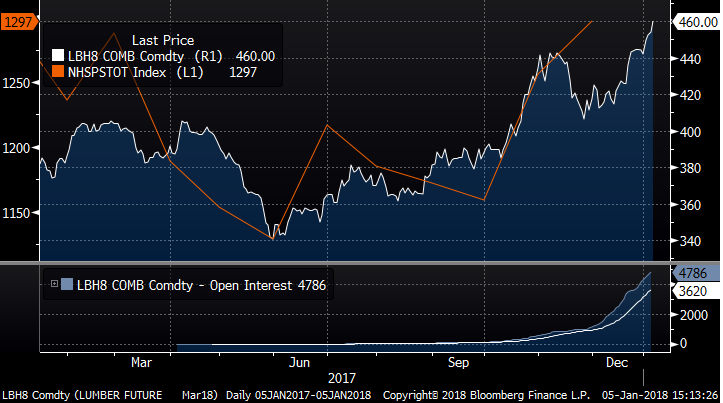
The current chart of the week is the lumber price per board foot. In 2017, the lumber price moved up about 10%. The largest use of lumber is obviously housing construction. Given the fact that housing starts have been very robust (orange line) this year, one has to ponder the NAFTA ramifications. Housing is a large driver of the U.S. economy. The economy is growing south of the border and, combined with the demographic trends, housing is a growth business once again. It will be interesting to see how the demand for lumber impacts the negotiations. The lumber-producing states will push for protectionist measures, to the detriment of the urban and semi-urban – and thus populous – regions, which want the best possible price on lumber. Time will tell…
Conclusion
Looking forward to 2018, the outlook is cloudy. While the economic tailwinds in Europe and the United States are expected to continue, especially given the stimulative fiscal measures, geopolitical turmoil remains a looming dark cloud. Canada’s economy is facing some structural challenges, but if the demand for many of our commodities continues on its current path, Canada’s economy should cause a positive surprise.
We cannot predict the “unknown unknowns”, but we can certainly ascertain the challenges and opportunities we are aware of:
- Markets are expensive, so we have to focus on long-term growth trends and pockets of value created by dashed expectations on the part of investors.
- New geopolitical events are possible, as the POTUS and the North Korean Supreme Leader continue their surreal tango while the Middle East remains the usual hornets’ nest.
- New technological advances will take hold around artificial intelligence, e-retailing, and robotics, as well as in pharmaceuticals and alternative energy production.
- The NAFTA renegotiations will likely involve a lot of trials and tribulations.
Our portfolios reflect our views:
In Canada, we are focusing on companies that have an export quotient, as we are not constructive on the Canadian economy. Furthermore, many of our selections are what many would consider smaller names as they offer more compelling value, and in many cases, higher dividend yields. We have also added to the oil and gas producers in many cases. We continue to like pipelines as they are attractively priced and offer attractive yields to investors.
In the United States, we have stayed away from the “go-go” sectors that are currently on fire, as we would expect them to be tamed during the next correction. Instead, Retail, consumer staples, oil and gas services are some of our new additions. The retail and consumer staples investments have paid off handsomely, while the oil and gas service names have rebounded.
In Europe, the consumer staples, telecom and pharmaceutical sectors continue to be our sectors of choice. Compelling valuations, attractive dividends and good growth prospects are the cornerstones of our selections.
Our cash reserves have been depleted in the fourth quarter. The next earnings season which is nearly upon us will determine if the cash balance will be augmented by the proceeds of stock sales.
As a final thought on the markets, it would be safe to say that many of the signs of the end of a cycle are upon us. We do not know how close to the end we are, but the signs are fairly clear. For instance, much of the equities that are “performing” are of the higher-risk variety, such as technology and smaller companies. The fervour around cannabis stocks and the bitcoin is another clue that the average investor is clearly in a “greed” mode and that the fear of losing has all but disappeared. We can also look at margin debt levels and consumer debt levels as other markers of this looming end of cycle. We at Exponent have seen this movie before. While we are looking to participate in the upside the current market sentiment can produce, we are under no illusion. The current mania could change on a whim thanks to a yet-to-be-identified negative catalyst.