
U.S. Stock Market: The Only Game in Town
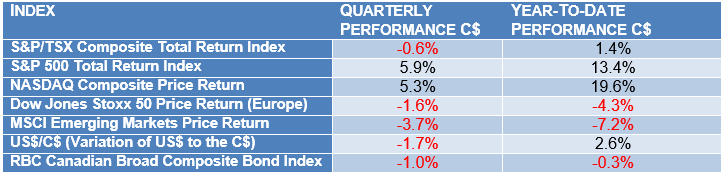
Performance Grid Summary
Executive Summary
The Canadian markets were slightly negative for the quarter. Uncertainty around economic growth, trade accords and some provincial elections, as well as a slowing real estate market, tempered investor enthusiasm for stocks.
The U.S. markets are the global leaders in terms of investment performance. Technology is leading the way, and compared to what we observed in our previous quarterly report (https://ex-ponent.com/market-update/en/2018-2nd-quarter), the leadership was a bit more diversified this quarter.
The bond markets in Canada and in the United States are struggling. In short, now is a bad time to be a bond buyer as rising interest rates are hurting bond prices. This is true all along the maturity curve. In fact, the only positive section of the fixed income universe is the more speculative (lower quality) corporate bond sector, which tends to behave very much like equities.
The loonie, on the other hand, performed quite well. The nearly 2% increase for the quarter versus the US dollar resulted largely from rising interest rates, optimism (which turned out to be correct) about a resolution to the free-trade negotiations, and rising oil prices.
Global markets continued to be weak. Emerging markets had heightened downside volatility associated with economic turmoil in Turkey and Venezuela. The Chinese economy is slowing which in turn is making it difficult for investors to get excited about that country’s stock market. The rising US dollar combined with rising interest rates in the United States is beginning to hurt governments and companies in developing countries who borrowed in greenbacks just a few years ago to take advantage of the then-low rates and an undervalued currency.
Simplified Quarterly Report
As part of our ongoing effort to improve our communications, we have made some changes to this quarterly report. As Steve Jobs was credited with saying: “the hardest goal to reach is to simplify”. Most of our readers have shared with us that they enjoyed the quarterly report, but wanted to read a simplified narrative.
To that end, we will focus on the four pillars of investing: economic growth, profit growth, valuations, and stock market leadership. The goal here is to share with you the pertinent data that we closely monitor and which lead to profitable investing.
Canadian Markets
Economic Growth
As you can see from the chart below, the quarterly GDP growth is slowing down to 2.4% (annualized).
Profit Growth
You will find below our consensus estimates for the S&P/TSX Composite Index (proxy for the Canadian markets) as reported by Bloomberg Finance L.P. as of the end of the third quarter of 2018. I would like to draw your attention to the orange “tick” marks. The expectation is for some continued strength in earnings and cash flow metrics. Debt growth is still a concern as is the lack of sales per share. Sales are not expected to improve dramatically but the debt burden is expected to be reduced. Our conclusion is that the growth in profitability is largely due to a rebound in energy prices, which is helping to boost the health of the index.
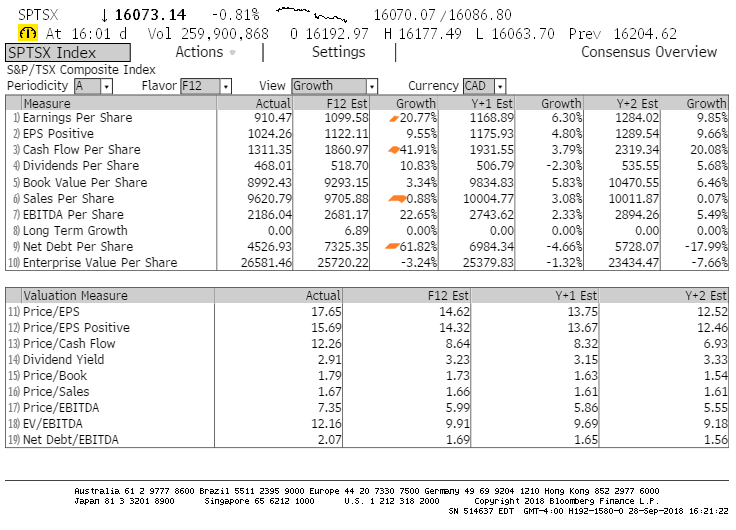
Valuations
Below is our important three-pane chart. The top pane tracks the price of the index over the past five years. Not much has happened in Canada for investors during that time. If we turn our attention to the bottom two panes, however, we can see that the valuation (price/earnings ratio) is now quite attractive vis-à-vis the past five years … and when compared to the U.S. market. Not only is the valuation now more compelling, the earnings are growing. This growth in earnings is thanks to higher oil prices which are helping the oil producers. As a matter of fact, we are positive on Canadian stocks for the first time in a long time. We bought some this past quarter and are watching a few others. We are not expecting this market to necessarily rocket forward in the near term, but there are now good bargains to be had in Canada.
Market Leadership
The charts below break down the performance of the Canadian market subgroups.
The leading group is by far the Health Care index – largely comprised, ironically, of cannabis producers. Conversely, the metals and minerals producers (think gold and copper) that make up the Materials index had a difficult quarter in the face of lower commodity prices.
The leaders on the TSX are still speculative/lower-quality stocks. You will also notice that Enercare, which is part of our selection, did make it to the leader board, thanks to its buyout offer. Interestingly, many of the top ten members were part of the worst-performing names a few quarters ago.
U.S. Markets
Economic Growth
The U.S. economy is doing extremely well. The GDP growth, at 4.2%, has not been this strong since 2014. Tax cuts and fiscal repatriation agreements (tax holidays) have all created a tailwind to what would otherwise be a normal pace of economic activity.
The U-6 “wide” unemployment rate (chart below) has not been this encouraging since 2001, with a level of 7.5%. The more conventional calculation came in at 3.9%, and you have to go back to the early 1970s to find a better performance. Wages are up and business optimism is running as high as ever.
Tax cuts combined with overseas profit repatriation policies (foreign multinationals were allowed to bring capital stateside without incurring double taxation) have buoyed much of the economic statistics. However, what this means in short is that it cannot really get any better than this, as inflation has yet to come in and challenge a great situation.
As of the time of this report, interest rates in the United States have made a dramatic jump in reaction to bond investors raising their expectations for future inflation.
Profit Growth
The chart below tracks investors’ and analysts’ expectations and is compiled by Bloomberg Finance L.P. I would like to draw your attention again to the orange tick marks. We can see that earnings and profitability expectations are quite high for the next twelve months, but are expected to revert to a more “normal” level in the following two years. Unlike in Canada, sales are growing. Debt levels are expected to rise dramatically next year, and to shrink after two years. Our conclusion is that tax cuts and profit repatriation have been used by companies to buy back shares (thus increasing per-share earnings and cash flow metrics).
Valuations
Our market valuation chart is illustrated below. The top pane depicts the price action during the past five years. We can see that the market broke through the 2,200-point level late in 2016. This price breakthrough came as the earnings increased significantly (bottom pane). In fact, we have seen earnings increase over 30% since 2016. The middle pane reveals an increase in risk appetite (as evidenced by the price/earnings ratio that investors were willing to pay) starting in the first quarter of 2016. In other words, the increase in stock prices results directly from this earnings growth AND an increase in valuation. However, in 2018, we see the price/earnings ratio decrease while earnings are still increasing. This is worth monitoring as it may be a sign that investors are losing their stomach for risk.
Market Leadership
The market leadership in the U.S. this quarter was more diversified than in the past few quarters; this is a sign of health.
While cyclical names such as microchips made it to the top of the chart, we did see some basic names make it into the top 10 – including Qualcomm, which we own.
Foreign Markets
While the U.S. market is doing quite well, European stocks in general are not following suit. Exceptions are found in some of the consumer stocks that manufacture products for export, much of which is destined for the booming economy in America. European interest rates are still stimulating economic growth but political uncertainty in Italy and England and economic strife in Turkey, are making investors cautious.
Elsewhere in the world, we are seeing the following phenomena; a rising U.S. dollar with rising U.S. interest rates are beginning to pinch emerging market borrowers, both corporate and sovereign. This situation bears monitoring, as many of these economies are also heavy oil importers. This threat curtails the growth of emerging markets. As a result, most equity indices sold off in Asia and South America. Above is the chart tracking the European stock index ETF (IEV) and the Emerging Markets ETF (EEM). Both have had a difficult year in 2018, with EEM suffering the most.
Our Currency
As illustrated below, the Canadian dollar versus the U.S. dollar was up about $0.02 during the third quarter of 2018.

Bonds and Interest Rates
The two charts below track interest rate levels for Canada and the United States. In both charts, you should pay attention to the white lines. Known as the yield curves, these depict the yield received on a certain debt maturity. You will find two sets of the yield curve in each chart. The top curves represent the yield on corporate bonds while the bottom curves chart the yield on government bonds.
Canadian Bonds Yield Curve

American Bonds Yield Curve

Both graphs show the same trend as last quarter’s. Interest rates on both government and corporate debts are rising.
Exponent is managing this development by having limited bond holdings relative to what our investment mandates allow. This helps insulate portfolios from rising rates. (As a reminder, the value of bonds moves in an opposite direction from interest rates: when rates go up, bond prices fall. Another way of saying this is that existing bonds become less valuable when money can be invested at higher rates.)
Options
Volatility stayed in a low range this quarter as the overall equity markets in the U.S. climbed.
The VIX index (chart below), which tracks the 30-day volatility of the S&P 500 index, spiked above 30 early this year. A VIX in the vicinity of 15 is ideal for option-selling strategies. Should the current market conditions prevail, we expect that our option premium income will increase as we replace the option sales that are expiring over the coming quarter.

Conclusion
We have been active this quarter, but more as a seller than a buyer. We have noted that Canada is showing signs of reasonable valuations and have taken advantage. In order for the Canadian market to broadly rise, however, an economic catalyst is required. Besides the energy sector, we doubt that we will witness one in the near future.
The U.S. market is by far the best-performing one in the world, but valuations are difficult to navigate. The market is priced for a perfect economic situation. It remains to be seen how long this current Goldilocks backdrop will remain. Europe is still an interesting geographic area to find bargains but the economic recovery of the Euro zone is not a smooth one due to the political landscape.
We look forward to working for you in achieving your financial goals and as always, we appreciate the confidence you have placed in each and every one of us at Exponent.