
No place to hide in 2018…
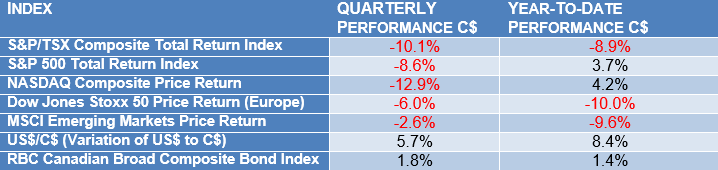
Performance Grid Summary
Executive Summary
The Canadian markets were down significantly in December and for the fourth quarter. The S&P/TSX Composite Total Return Index (proxy for the Canadian markets) went back down to its 2007 level. Investing in Canada, the lost decade: it’s déjà vu all over again. For most of the past decade, the only way to make some money for Canadian investors was through international diversification. However, this year, diversification did not work.
Once again, the U.S. markets were among the performance workhorses in 2018. The rise of the US dollar certainly helped, from a Canadian investor perspective. However, this market leadership was threatened as the darling sector – technology – suffered a historic drop in the final quarter of the year.
The bond markets produced a barely positive performance in 2018. However, despite rising rates, most bond investors saw some positive performance… unless they invested in lower-rated issuers. These were hit by substantial sell-offs as the higher risk they entail became too much to bear.
The loonie performed quite poorly in 2018. The US dollar gained nearly 6% in the last quarter, and over 8% for the year. Clearly, investors were buying US dollars in a flight-to-safety reaction.
Global markets continued to be weak. Equities were weak, whether in emerging markets or in most developed markets. This past year was one of the few ones where diversification did not work. In US dollar terms, all markets had negative returns.
In short, 2018 was a difficult year for investors across the board. If your portfolio had a positive performance, you should be very pleased with it (and tell your friends about your portfolio management team!). If your portfolio performed with only a slightly negative result, you should be rather satisfied with it.
Canadian Markets
Economic Growth
As you can see from the chart below, the quarterly Canadian GDP growth is slowing down to 2.2% (annualized). The falling oil and other commodity prices are large contributors to the slowing economic performance. And a slower growth intimates that interest rate hikes by the Bank of Canada – if any – will be muted.
Profit Growth
You will find below the consensus estimates for the S&P/TSX Composite Index (the Canadian market proxy) as reported by Bloomberg Finance L.P. as of the end of the fourth quarter of 2018. The consensus, in our opinion, appears to be overly aggressive. We will continue to monitor these expectations and would expect them to fall back to more sober levels.
Valuations
Below is our important three-pane chart. The top pane tracks the price of the index over the past five years. As you can see, the index has stayed within a narrow 4,000-point trading range for the past five years. Turning our attention to the bottom two panes, however, we see that the valuation (i.e., the price/earnings ratio) is now rather attractive when compared to what it was during the past five years, and when compared to the U.S. market. We can officially call Canada an investment bargain in many sectors. While the growth prospects are much more muted here than in other economies, the prices have fallen to such a level that we are finding many Canadian equities very appealing.
Market Leadership
The charts below break down the performance of the Canadian market subgroups.
In a down year for the overall market, it follows that the more stable groups of the index would take the lead. Indeed, consumer staples (think grocery stores) and communication services (think BCE or Telus) shone. As for the health care index – largely comprised, ironically, of cannabis producers –, it suffered greatly in the fourth quarter, despite a strong start to the year.
Interestingly, the leader board on the TSX this quarter is made up of a slew of gold producers, joined just barely by a grocery store chain (Empire). Both sectors have been weak for a number of quarters. Conversely, oil and gas, cannabis producers, and two Canadian aerospace names make up the list of the worst-performing names in the fourth quarter of 2018.
U.S. Markets
Economic Growth
The U.S. economy is doing extremely well, with a GDP growth at 3.4%. December’s equity sell-off resulted directly from a slight slowdown in economic growth. However, as illustrated by the chart below, the U.S. economy is still growing, and has been since late 2008. During the quarter, investors worried that the slower growth was a precursor to a recession. We are of the opinion that we are entering the mature phase of the economic cycle, characterized by slower growth – as opposed to a contraction in growth –, higher interest rates, low unemployment, and usually, higher commodity prices. However, we do not yet see on the horizon the recession that investors were fretting about.
The U-6 “wide” unemployment rate (chart below) continues to be very strong. The more conventional calculation came in at 3.9%, and one has to go back to the early 1970s to find a better performance. Wages are up and business optimism continues to be running as high as ever.
We would expect that these statistics will be affected by the U.S. government shutdown, but this should be momentary in nature.
Profit Growth
The chart below, compiled by Bloomberg Finance L.P., tracks investors’ and analysts’ expectations. Economists continue to be optimistic – overly so in our opinion –, as illustrated by the expectations for earnings growth. Meanwhile equity investors have diametrically opposed expectations as they have sold off stocks for most of the fourth quarter of 2018. The question is, are stock valuations reflective of the economic landscape? Read on…
Valuations
Our market valuation chart is illustrated below. The top pane depicts the price action during the past five years. We can see that the U.S. market has lost most of the advance made since the election of Donald Trump. However, the two bottom panels reveal that the price investors are willing to pay for each dollar of earnings (the price/earnings ratio) has fallen substantially. The bottom pane depicts a strong actual backdrop as earnings continue to grow. Thus we are of the opinion that the recent sell-off is due to excessive negative expectations. We do expect that earnings will slow as the economy falters. However, these valuations make the market much more reasonably priced as the slowdown is most certainly priced into current quotations.
Market Leadership
The total return for the S&P 500 in US dollar terms was -13.84%. Defensive sectors had positive leadership, such as the gold producers and the utilities. Homebuilders, companies operating in the oil and gas sectors, and technology took the lead on the downside.
The individual names illustrated below also add some interesting colour to the events of the last quarter. The slow and boring home product manufacturers, gold producers, and coffee retailers dominated the best performers, while oil and gas producers, drillers, and chip manufacturers had a very difficult fourth quarter of 2018. This type of result is the consequence of investors fleeing high growth names (which were highly priced) for the safety and dependability of products like soap and coffee.
Foreign Markets
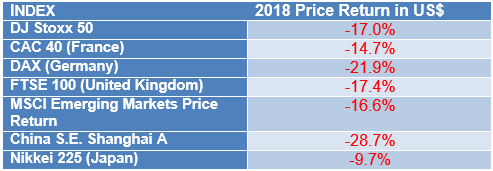
While U.S. equities had a difficult year, the European ones had an even more difficult time: they were down 17% in US dollar terms. The euro itself lost 5% against the US dollar. Such weakness was not only a European phenomenon, as Asian markets had a difficult 2018 as well.
The conclusion is that international diversification did not add any value. In fact, one could argue that the last quarter of 2018 was indeed the correction that all market participants had been waiting for. Despite these negative prevailing winds, Exponent portfolios held up quite well. Indeed, some mandates produced a positive return for 2018. The reason is that our picks of the slower, more prudent companies with defined and generous dividend policies that trade at reasonable valuations tend to do better when investors are skittish. In some cases, they will flock to these stocks and drive up their prices despite a negative trend in the overall markets.
Our Currency
As illustrated below, the Canadian dollar versus the US dollar was down significantly during the year. The US dollar cost us about $1.25 early in 2018, and by December 31st, the cost for the same dollar had jumped north of $1.36.
As mentioned earlier, this was in our favour: as Canadian investors on the U.S. markets, you benefited from a rising US dollar.
Bonds and Interest Rates
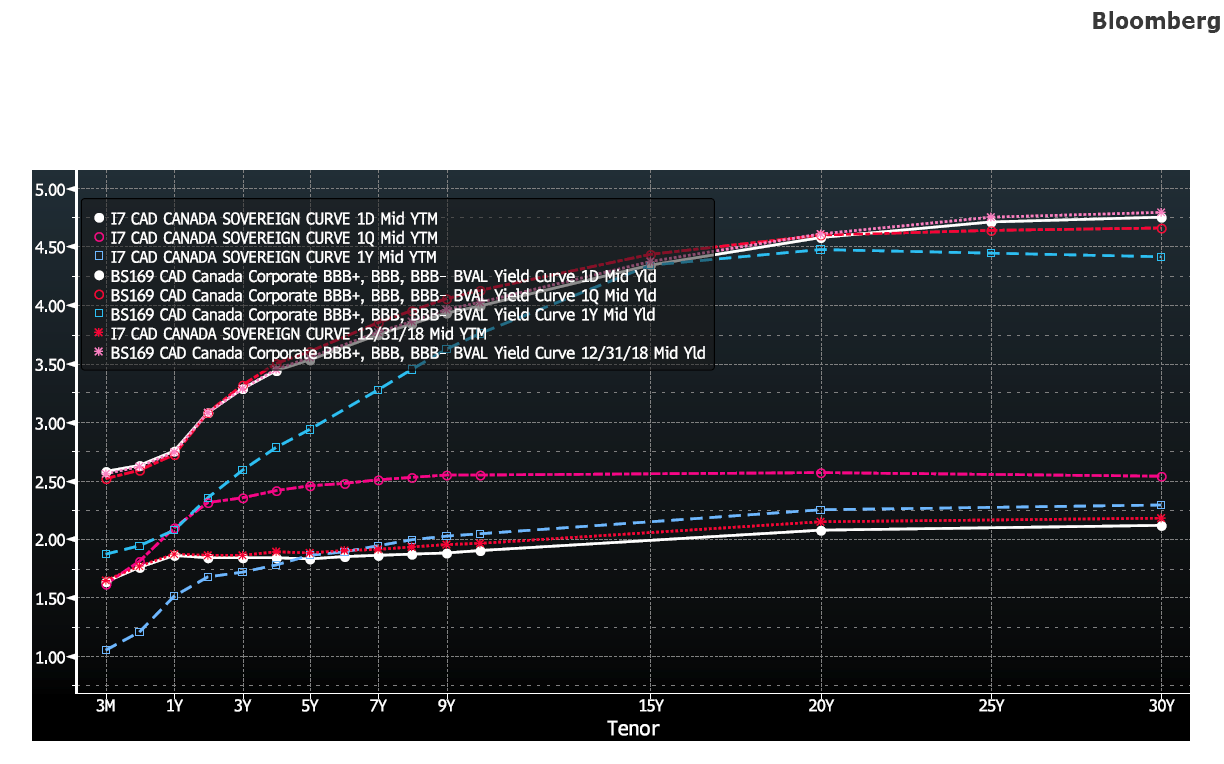
The following two charts track interest rate levels for Canada and the United States. In both charts, what you should look at are the white lines. Known as the yield curves, these depict the yield received on a certain debt maturity. You will find two sets of the yield curve in each chart. The top curves represent the yield on corporate bonds while the bottom curves chart the yield on government bonds.
Canadian Bonds Yield Curve
American Bonds Yield Curve
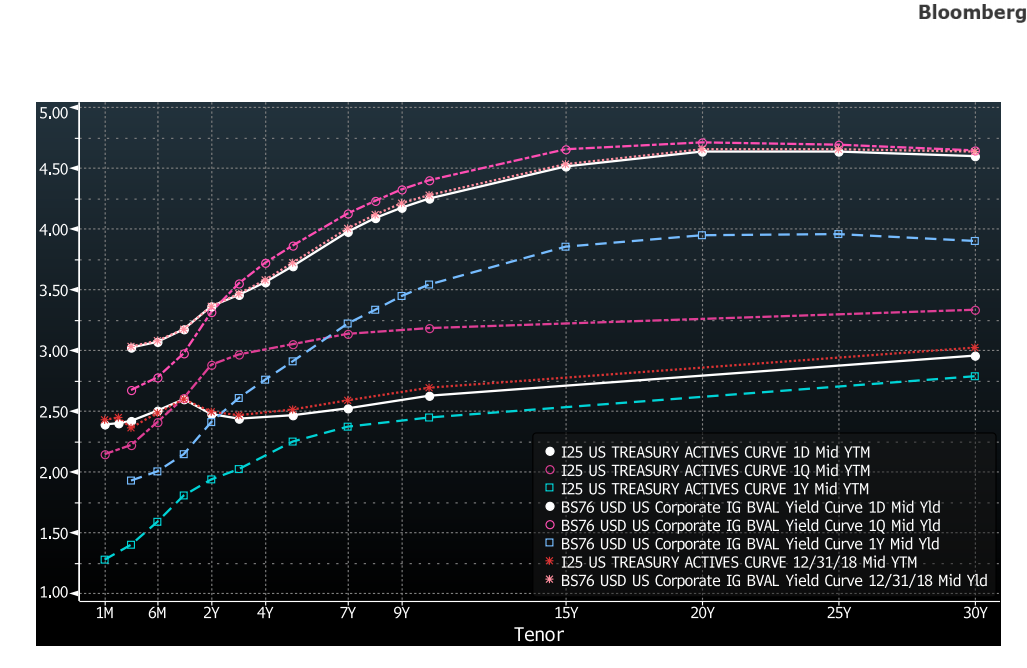
Both graphs show the same rising trend in interest rates. The white line, being the year-end 2018 yields by maturity, tells us that rates peaked back in September 2018. However, interest rates are still substantially higher than they were at the end of 2017.
This means that the expectation of higher interest rates has subsided. We should therefore see a lower US dollar over the next quarters, and perhaps even higher commodity prices and better emerging market performance.
The sobering economic news and soft equity markets clearly have spooked investors and curbed their expectations of higher interest rates. As a result, the second half of 2018 was kind to bond investors as bond prices increased as a result of falling interest rates.
Options
Volatility climbed up this quarter as the overall equity markets in the U.S. spiked, then fell in late December.
The VIX index (charted below), which tracks the 30-day volatility of the S&P 500 index, spiked above 30 early on, and again late this year. When the VIX is in the vicinity of 15 (or higher), the moment is ideal for option-selling strategies. While option premiums are back to being very attractive, existing long stock positions in the option strategy suffered in the broad market sell-off. Strategically, we have significant cash holdings in the option accounts that we will deploy over the next few weeks to take advantage of lower prices and higher option premiums.
Conclusion
Markets peaked at the end of last September. We were sellers during the third quarter to harvest our profits, and we have been active buyers during the fourth quarter sell-off, to take advantage of some excellent bargains. Our focus rests increasingly with Canadian stocks, where valuations are at historic lows, and dividends are some of the highest we have seen in years.
The fourth quarter sell-off can be explained simply. For the first nine months of the year, economic growth in the United States was very strong, thanks to new tax policies, a strong currency, good global growth, and the ramp-up in production to get ahead of tariffs. In the last three months, investors turned their attention to the Fed’s program of raising interest rates, the negative impact of trade policies on the global economy, and the unintended effects on emerging markets of a strong US dollar.
Much like the crowds that I witnessed on Time Square on New Year’s Eve, the reality is never as good or as bad as the talking heads on TV make it out to be. People will line up for hours, stand in the pouring rain and cold to be part of an event that they could have watched in the comfort of their homes. We humans are wired this way. We follow the crowds, regardless of how ridiculous the actions or how slim the reasons.
Economic news was overhyped in the summer, and excessively discounted in December. Investors simply overreacted to the change in narratives.
At Exponent, as your portfolio managers, we cannot predict when the crowds will change their behaviour from mad buyers to angry sellers. We can only observe the crowd actions and media reporting. We raise cash when the fundamentals are not nearly as good as what stocks quotes paint them out to be, and we turn into buyers when investors become overly depressed about prospects. We accept that our timing will sometimes be less than perfect, and we focus instead on reading the trends correctly, as this is the key to creating value.
We do not see evidence of being at the end of this economic cycle, but rather in its final phase, which can last anywhere from two to three years. We will continue to act rationally and make the best investment decisions we can in light of all available information. The role of a portfolio manager is to make decisions using the best data available while knowing that the future can never be perfectly anticipated.
We look forward to helping you move closer to your financial goals in the New Year, and we wish you much health and prosperity. As always, we appreciate the confidence you have placed in each and every one of us at Exponent.
Benoit Poliquin, CFP, CFA
President / Lead Portfolio Manager