
Last quarter we expressed caution about the market. A long-run up in stock prices will do that to any diligent portfolio manager. The quarter was fraught with volatility as the August pull back was followed by a new all-time high in late September, which then gave way to another slide at the end of September and in turn continued into October. No markets were spared. The US dollar and bonds rallied on this volatile backdrop. For many the August and September month-end statements brought negative news. It reminded us that markets can indeed come down. It is our belief that this type of market action is actually a healthy phenomenon and should be viewed as an opportunity.
Market Drivers
At Exponent Investment Management Inc. we rely on our own research. We want to share with you our views about corporate earnings, valuations, and interest rates:
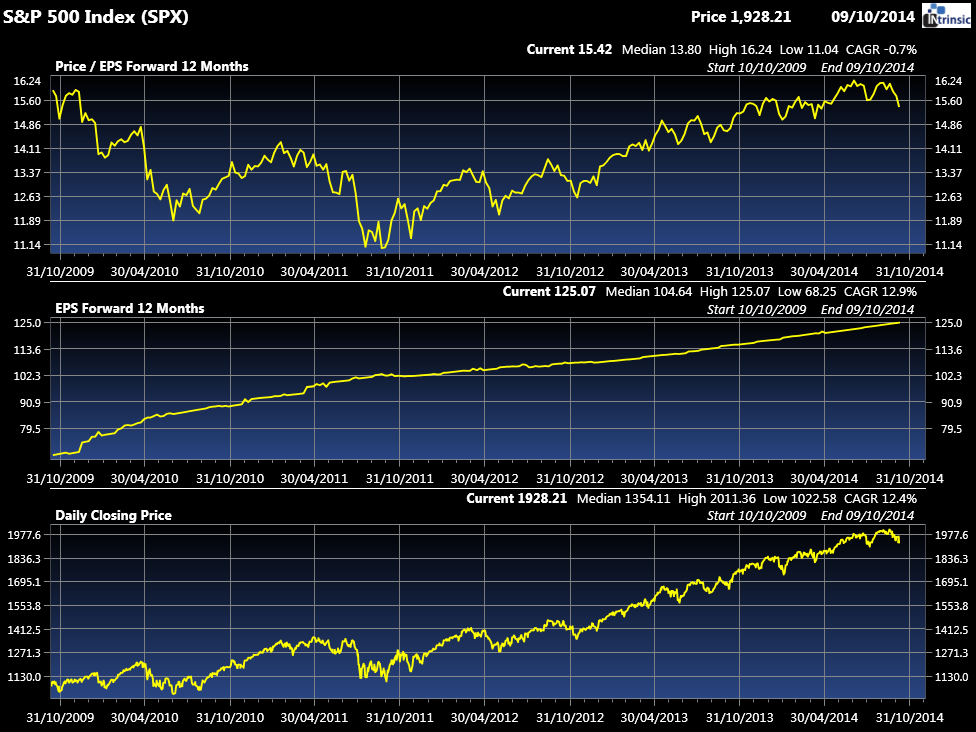
Valuations: The top chart on the above is a valuation metric called the forward PE ratio which measures what investors are paying for the expected earnings over the next twelve months. When investors are jubilant, they will bid up each dollar of earnings. The top chart shows that the Forward PE is sitting well above the 5 and 10 year average as it is sitting at a ratio of 15.42 (last quarter it sat at 16.2). The highest ratio we have seen in the past ten years is 17.4 with the ten-year mean of 14.6.
Earnings: Stock prices will always follow earnings. The chart in the middle is the expected earnings for each share of the S&P 500. Coming out of the last recession, the earnings have essentially doubled.
Risk appetite: While corporate earnings have grown, the appetite for these earnings on the part of investors has been variable. The data does support that, while stocks are not a bargain, they are not in a danger zone in terms of valuations. As of this update, the current market weakness is revealing some attractive buying opportunities
Our conclusion, therefore, is that the current market correction is a normal phenomenon as it brings valuations closer in line with prevailing risks.
U.S. Market:
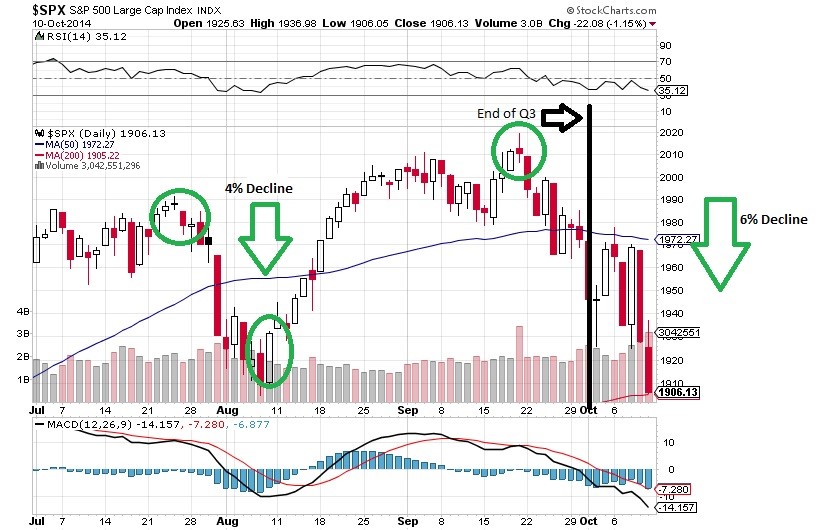
The US market, as illustrated by the S&P 500, is up 14.1% in CAD terms for the year through the end of September. For the second quarter, the performance was 6.1% in CAD terms. This quarter was volatile indeed, a 4% drop during August, followed by a new all-time high in late September, which then gave way to another 2% drop at the end of September and which continued into October. As of the time of the writing, we were looking at a 6% decline; the year is still a positive one, but is now closer to the expected long term growth averages.
As we can see with the S&P 500 chart above, the recent market action in October has led many to feel uncomfortable about the markets. We have to go back to the summer of 2011 for a similar downward fall. For those of us who are long time investors, this change is not unexpected, but it still does not make the experience any more pleasant.
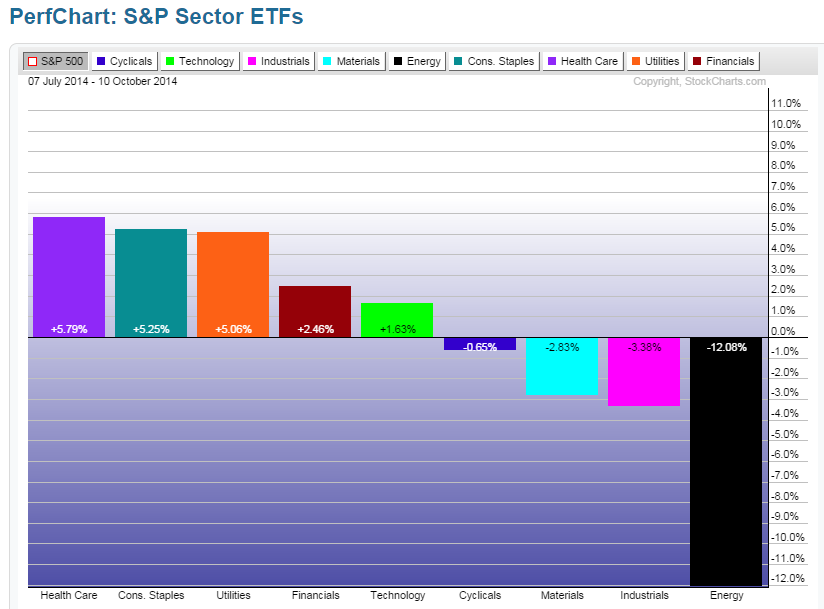
The above chart is referred to as the market attribution chart. This chart tells the reader which sector of the market influenced the overall performance. From early July up to early October, the energy sector was the big performance driver with a -12% return for the period. This is a mirror image of the second quarter where the energy sector was the positive catalyst for that quarter’s substantive performance.
The positive return of half the sectors is also a significant positive. In severe market panics, one will usually find that almost ALL the sectors are posting negative performances. So far, the evidence points to the recent market action as a correction.
Canadian Market:

Canadian markets posted stellar returns so far this year. The TSX composite posted a total return of 12.9% for 2014 and 6.4% for the quarter. The Canadian market is unique, given the fact that three sectors clearly dominate the market, – financials, energy and materials.
Up until the end of the second quarter, the energy sector posted a return of 21%, the materials sector 16%, and the financial sector a respectable return of 8.7%. By September, these impressive positive numbers all changed. The trend reversed and by the end of the third quarter, the energy sector was down 6.6% and the materials, 10.1%. However, the financials managed to post a 2.7% return while the utilities sector posted a flat return.
The third quarter plus ten days in October (see the below chart) clearly show how the materials AND the energy sector have been hurt significantly. It is important to remember that lower energy stocks have been the result of falling oil prices. This change is actually good news for the economy and all of us as consumers.
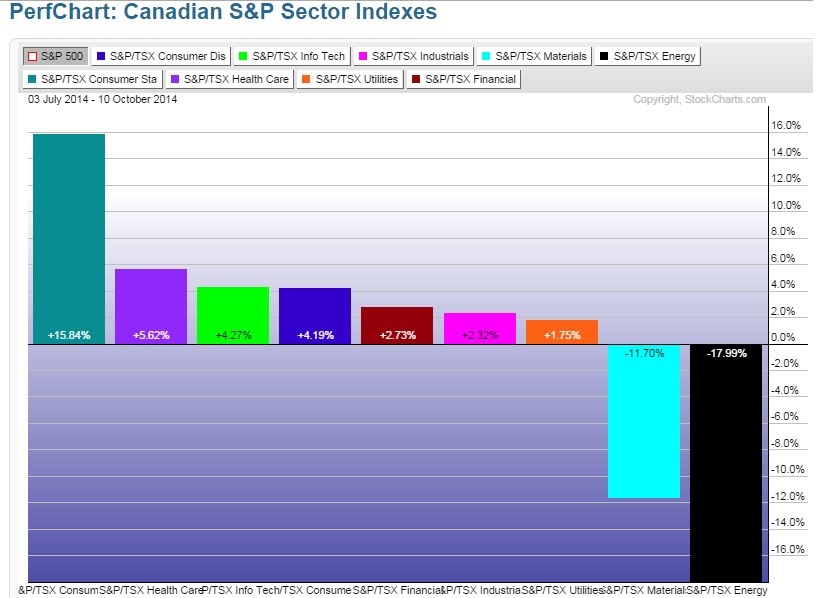
The materials sector is suffering because the gold market is down thanks to a booming US dollar, as is the mining sector currently distressed by a managed Chinese economic slowdown. China is essentially trying to avert a debt-fuelled bubble and the central authorities for some time have been busy instituting measures to slow down the economy. The latest being the reinstituting of import tariffs on coal. We are still investors in both sectors because stock valuations are VERY cheap. They will probably not increase next week or next quarter, but over the next three to five years cycles will turn up…they always do. The trick is to buy cyclical stocks when they are down and not try to catch them at the very bottom. Patience is helpful and, indeed, necessary and we have found that dividends received can markedly demonstrate the rewards of patience.
Europe:
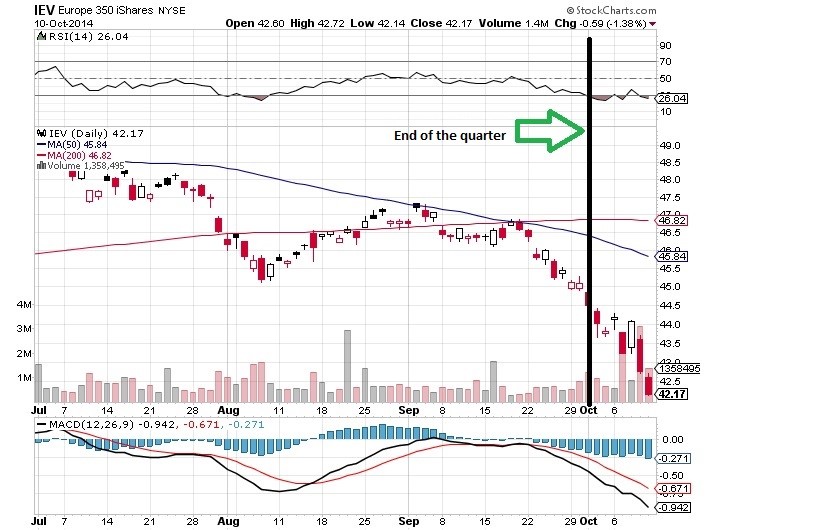
In Europe, as illustrated by the above chart, the markets produced negative returns of 8.6%. Here, the economic sanctions on Russia have begun to be felt on the industrial export economies of countries like France and Germany. On a positive note, however, the European Central Bank announced nearly €700 Billion in measures which closely resemble the US Federal Reserve Quantitative Easing Program. The immediate impact was felt on the currency market. On June 30th, one could sell 1 USD and receive €1.37, but as of October 10th, the exchange was €1.26 for every 1 USD, a decline of 8%.
Despite the fact that European stocks have put in a credible performance, when we convert these results into USD as per the above chart, we see negative ones.
This type of initial reaction in the currency market to Central Bank operations is quite normal. One of the classic ways to restart economic growth for an industrial trading economy is to lower rates, an action which renders exports more competitive and makes imports more expensive. Second, lower interest rates increase the value of assets such as stocks, bonds and real estate. This is the approach the US Federal Reserve initially took back in 2009. The current economic revival in the US took nearly five years to take hold. European stock investors will need to exercise patience as well. European stocks still offer attractive value for investors as the European large capitalization indices are yielding 3.65% compared to 1.93% in the US and 2.45% in Canada.
What Moved the Markets?
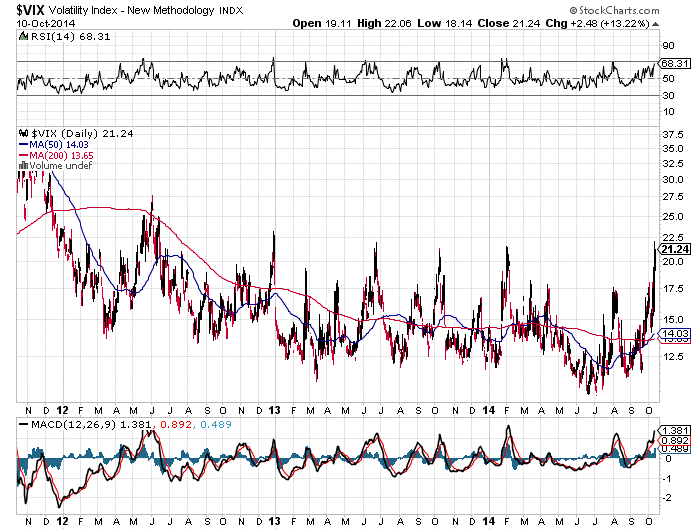
The VIX index is currently at a three year high. Remember that spikes in the VIX (S&P 500 volatility index) indicate periods of market uneasiness. What the VIX also tells us is that investor complacency is no longer an issue, a fact which is uncovering prospective purchases. A higher VIX also makes selling options a much more profitable endeavor than it was just a few weeks ago. Since option prices depend on volatility, a higher volatility means larger proceeds for option sellers. We are continuing to monitor the VIX because it can give clues about short term market trends. We would expect higher VIX levels should the markets continue to sell off.
Interest Rates:
In times of elevated stock market volatility and harsh declines, many will seek refuge in the bond market. However, the US Federal Reserve has indicated that higher rates are in the cards since it will end Quantitative Easing operations this month and is looking to raise short term interest rates in 2015. Such operations are considered necessary because the current employment numbers are very encouraging. The US Federal Reserve also will now turn its attention to ensuring that inflation does not turn this economic recovery into runaway inflation, another positive sign.
The Canadian Bond Market
All is moving in the right direction for Canadian Bond investors. The total return for the RBC DS Broad Composite Index is 5.9% for 2014. The quarterly return was 1.1% with long-term bonds responsible for most of this performance with their return of 2.2% for the quarter. Since the end of the quarter, the Canadian Bond Index is up another .94%, largely a response to the turmoil in the equity market.
The current investor appetite to bonds leads to an interesting situation. The Canadian banks have not seen their stock price participate to the same extent in this correction. We believe the lower interest rates have largely contributed to this outperformance. If the equity markets are correct, and have re-priced global economic growth which has resulted in lower commodity prices, it only follows that these events will trickle down to banking profits sooner or later.
Lower interest rates are also helping utility stocks. The current valuations of these stocks can only be considered as stretched or even priced for perfection. One would think that lower energy prices should lead to lower traffic on the part of producers. Even though recent senior pipelines stocks have fallen 10% from their peak, should interest rates normalize, investors in these names will face their own performance challenges.
The U.S. Bond Market
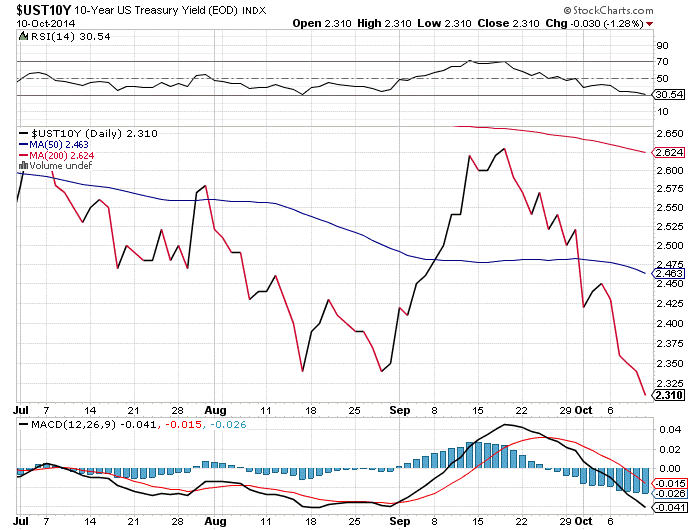
We have charted above the 10-Year bond yield chart for U.S. Government bonds. The time frame is from the beginning of the third quarter through October 10th. Interest rates fell from 2.64% down to 2.31% largely as a result of the turmoil in the equity markets. The result is that prices for the 10-year Treasury Bond rose 2.4%.
This is an interesting situation since the US Federal Reserve is about to end its bond purchasing program. So, while poor equity markets are proving to make bonds an alluring safe haven, it remains to be seen if this situation will continue once equity markets stabilize.
These lower interest rates combined with the potential for their rising thanks to the US Federal Reserve’s policies, should give equity markets a base; after all, who wants to lock in for the next ten years when returns only equate the current inflation rate when dividend yields, dividend growth, and potential appreciation make equities prices post correction, an attractive alternative.
A Correction Playbook
- If you prepare for a correction during a correction, it is probably too late.
- The market always takes the direction that is most painful (i.e. opposite) for speculators and mainstream investors.
- It is the unknown unknowns that will sink you. Focus on what you can know.
- Be prepared to buy.
- Be prepared to sell at a loss, as a correction is an opportunity to buy a better name currently selling at a discount.
- You will never time purchases perfectly.
- Always look to upgrade the quality of your holdings; everything is on sale.
- This is not the first correction, nor the last.
Our Opinion
In last quarter’s report, we were very cautious and some might even say bearish. Well, while we were right, we are not necessarily jumping for joy. We had been raising cash during the Spring and Summer months because our sale price targets were triggered while at the same time we were unable to find value.
Much, of course, changed in mid-September. We have added a few names and plan on adding more over the coming weeks. We will follow our “correction playbook” outlined above and do believe that while corrections are often harrowing, this particular one was long overdue. Having said that, we suggest that, opening monthly statements or logging on to your account might not be the happy experience it was just a few short quarters ago. The silver lining, however, is that opportunities will once again rise to buy quality companies at good prices.
Looking ahead, we would be surprised to experience the same double digit returns we have all come to know and love during the past three years. As investors, we need to understand that in a low inflation/low growth environment, mid to high single digit returns are what the markets normally yield. Trusting us to manage your assets also means knowing that we will act prudently, both in good markets and bad ones.