Short Review
In-Depth Review – Charts and Data
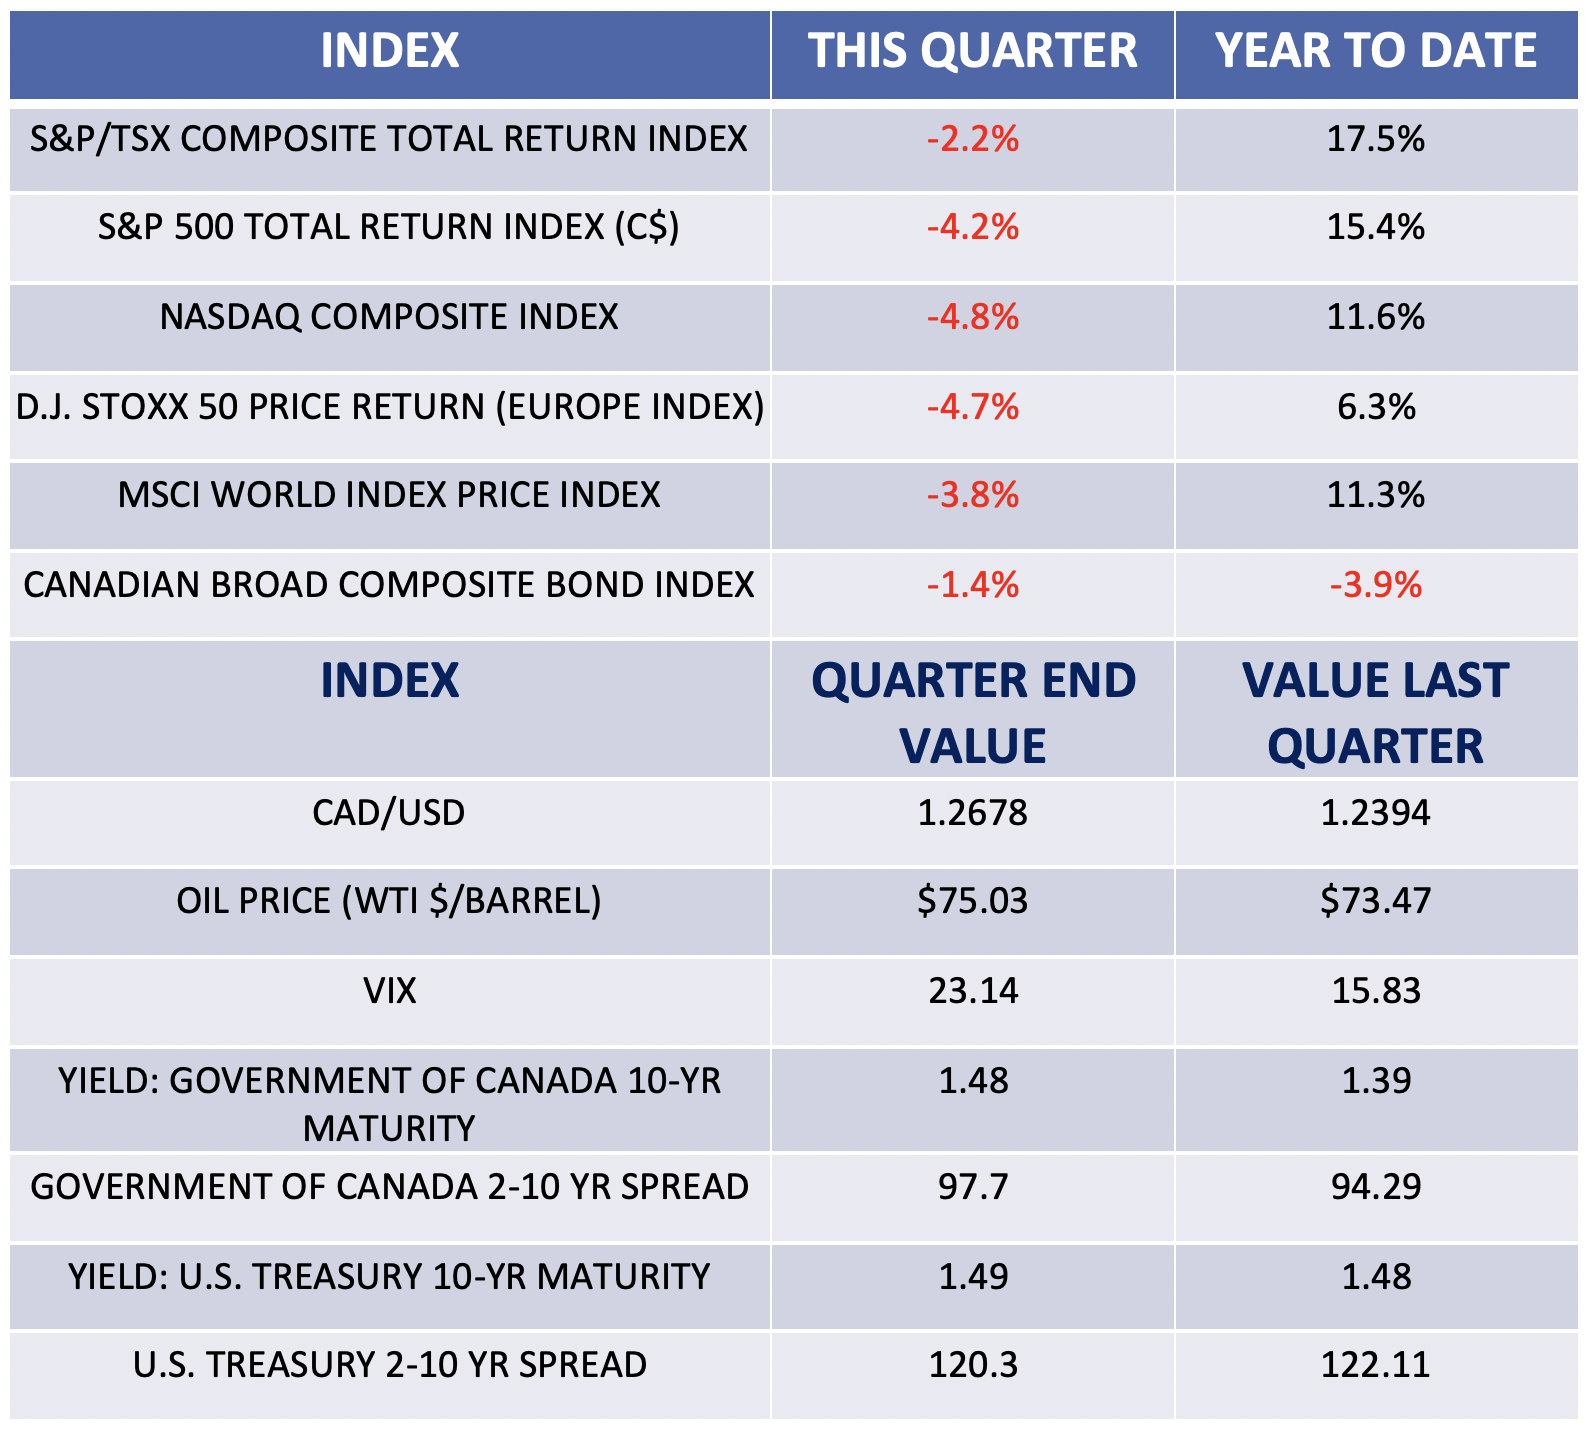
Market Returns Were Down this Quarter, While (Most) Bond Yields Inched Up
Commentary
The movement of people and goods through the economy, which remains “clumsy,” hinders the recovery. This means that our economy will not be back to pre-pandemic levels until goods and services can be delivered as seamlessly as they were before.
Many industries will be changed forever, and some will see long-term effects. However, not all these changes will be negative. At Exponent, we have focused on finding the beneficiaries of the pandemic aftereffects.
The unintended consequences of various policy decisions made over the last decade are coming home to roost. A labour demand mismatch with the labour supply, a push toward a sustainable energy transition, and stringent public health measures are all contributing to unprecedented upheavals in certain sectors. But for those who study the markets, uncertain times are the most interesting and often profitable times if one is willing to question the accepted narrative. For instance, the commodity sector, shunned for over a decade, has become a stellar performer. This sector is still “under-owned,” as it has suffered many false starts over the years. Yet, from oil to natural gas to most industrial commodities, it is the place to be right now.
For this quarter, bond prices were down, though not as much as could be expected given the level of inflation that central bankers are claiming to be transitory. A portion of the world’s population remains completely locked down, while most countries continue to impose mobility restrictions over people and goods (think tariffs and red tape). This lack of fluidity leads to imbalances that translate into price increases and slower delivery times.
For many, the pandemic is waning, but its aftereffects and the associated health measures will be akin to a “long COVID.” Some sectors suffer from high valuations, which is skewing the overall averages, but beyond the headlines, exciting investment opportunities are appearing – something we had not seen for many quarters.
We remain steadfast in our approach to be open and prepared for both better-than-expected and worse-than-expected outcomes in the markets. We will react and adapt as information and data (as opposed to headline noise) support making judicious portfolio changes. Our preferred approach will continue to be about making incremental changes in exposure, both in terms of new sectors and total weights within your portfolio.
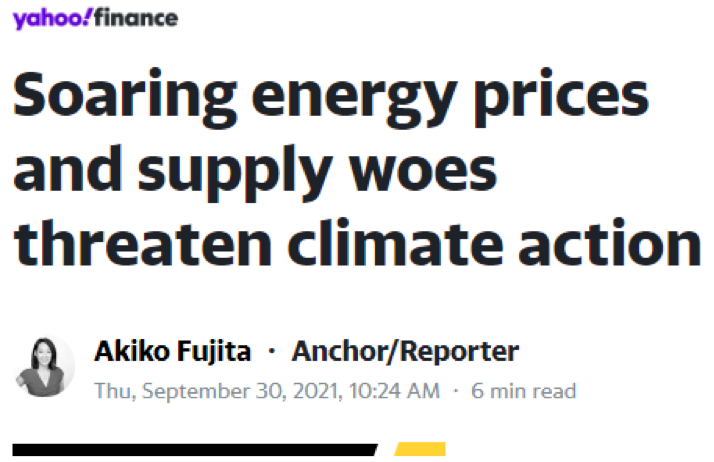
Headlines Are Dominated by Bottlenecks

Energy Prices
Jobs

Performance Drivers
Rockets
- Oil and gas. These commodity stocks are moving up on supply constraints and demand moving back to pre-pandemic levels. Especially natural gas, up 130% so far this year! Current levels had not been seen since the 2005-2008 period, when the commodity was trading in the low teens.
- Pharma/Biotech. Obviously – the pandemic is still underway!
- Leisure stocks. Have you tried to buy a boat, RV or motorcycle lately?
Flares
- Gold and gold mining: With the strong U.S. dollar, gold tends to fade.
- Cannabis stocks: The market was hit with oversupply, hurting all the players.
- Logistics companies: Labour shortages and bottlenecks reduced their volume, making profits fickle.
Investing Lesson – GDP and Economic Growth
For most people, economics and its impact on investing can be confusing. Let’s shed some light on the subject.
GDP (or gross domestic product) is a way to calculate the total output of an economy. View it as the speedometer for a country’s economy. The total GDP will fluctuate, and ideally increase over time. This fluctuation, if it is positive, is economic growth. Two successive quarters of what economists call negative growth in GDP is defined as a recession.
When you read about the (positive or negative) growth in economy, this refers to the rate of change in GDP. In other words, the change on the speedometer of the economy.
GDP Equation
GDP is comprised of four components:
Consumption by the private citizens of the economy (or “C”);
Investments made by businesses and households (or “I”);
Government spending (or “G”);
Net exports, i.e., exports minus imports (or “NX”).
For those who like formulas, GDP = C + I + G + NX.
The past 18 months have seen dramatic changes in our GDP’s components. Just like fashion, economics have trends where one or two components will be the focus. What is clear to us is that the current trend is for a large “G.” However, large government spending can reduce the “C” and the “I” components, which means that any improvement in GDP will be muted. Conversely, a large “C” or “I” component can lead to reduced “NX” or even lower “G,” as the private sector delivers services that were once provided by the public sector. (Examples would be private jails or private healthcare.)
In short, the rate of change in one of the components can come to the detriment of one or many of the other components of GDP, which will then mute the positive effect on GDP. Our goal is to understand the reasons for the changes in each component of the GDP.
Unintended Consequences – Underinvestments
For investors, companies’ chronic underinvestment is coming into focus as a risk. Who wants to own a tech company that does not invest in research and development? However, underinvestment can also be an opportunity. For instance, owning a solid commodity producer where most of the industry has chronically underinvested can lead to substantially higher prices as the commodity reserves are depleted.
Healthcare
The pandemic in Canada has demonstrated that underinvesting in both the infrastructure and talents in healthcare can have some very costly results. In the trading world, we call that “picking up pennies in front of a steamroller.”
The structural challenges of a national healthcare system are directly linked to the demographic shift to an aging population. When Tommy Douglas introduced universal healthcare in Saskatchewan, in 1962, life expectancy in Canada was 71 years. Currently, it is nearly 83 years. Of that increase, the additional 12 years are the costliest from a healthcare perspective.
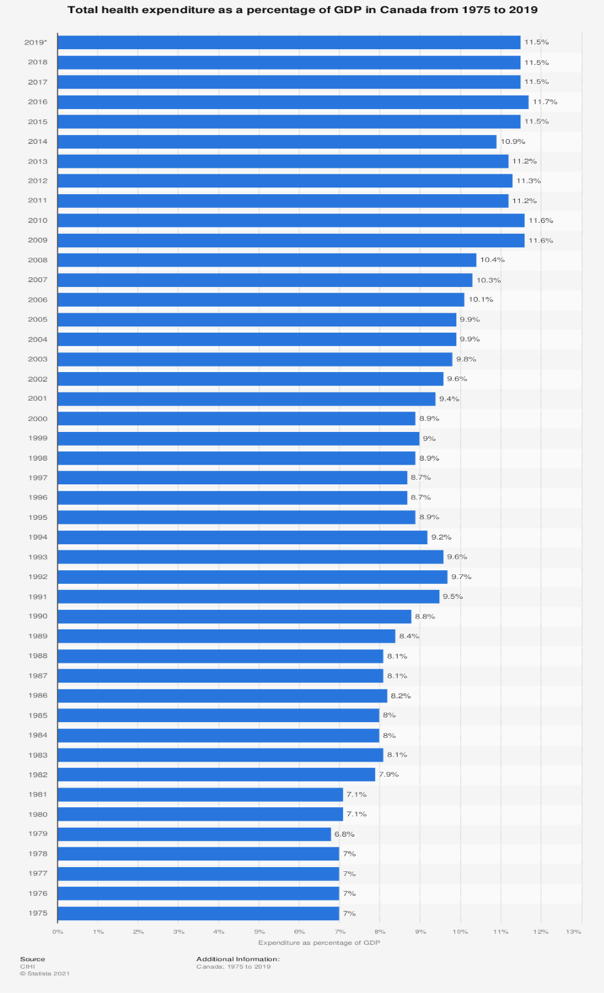
What does healthcare financing have to do with investments? Healthcare represents over 10% of GDP in Canada. This number has grown from 7% of GDP in 1975. In dollar terms, this means both that the GDP has grown since 1975 AND that the share of GDP devoted to healthcare is also higher. In other words, healthcare spending is a very large component of government spending in our GDP equation.
Infrastructure
As of the time of the writing, our neighbours to the South are debating a $3.5 trillion spending envelope, of which $550 billion in new federal investments in infrastructure spending will take place over the next five years.
For anyone who has spent any sort of time in U.S. airports or some of the largest American cities, it is obvious that some of the existing infrastructure could do with some attention. However, $110 billion per year for the next five years sounds expensive, and it will follow a U.S. federal spending spree of about $143 billion in 2020 on infrastructure.
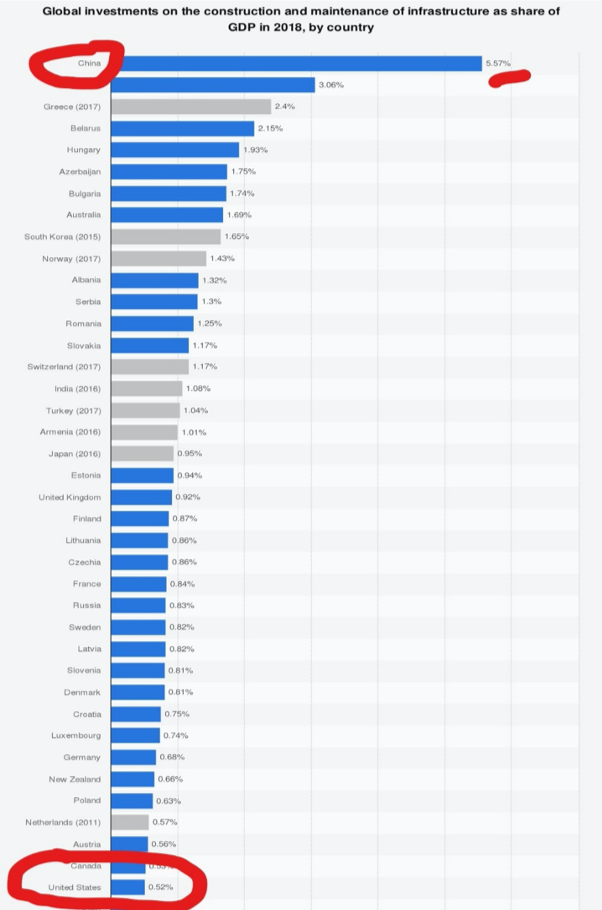
Back to our GDP equation, this infrastructure bill will have an impact on the “G,” but it might also crowd out and displace the “I” on the part of private economic agents in the process. Furthermore, infrastructure spending represented about 0.5% of GDP in 2018 for the United States and Canada, while China spent nearly 6% of GDP in infrastructure. The question is whether infrastructure spending leads to a larger GDP or is a function of a strong GDP?
Commodities
Socially responsible investing is one of the growing themes that has taken hold in the investment industry. While the premise is unassailable, the unintended consequences are predictable. Groups of investors are pressuring companies or even shunning certain sectors to curtail and move away from resource extraction. Whether we are talking about oil, copper or sawmills, the result is the same. Let’s look at one of the world’s largest energy producers: Royal Dutch Shell. Here is its capital expense budget to 2020:
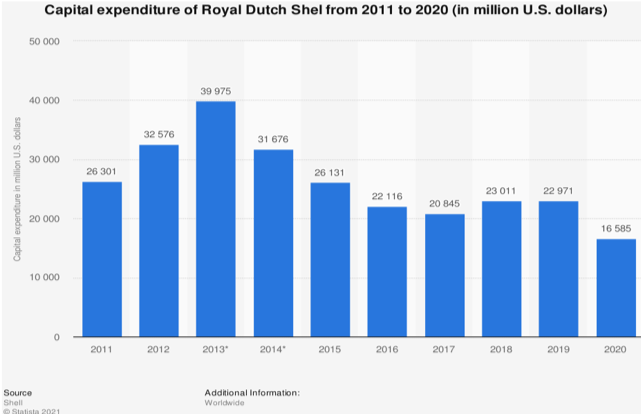
Company management, who used to be hired to grow the resource pool and make the company as efficient and proficient as possible in the extraction activities, are being incentivized to move away from these efforts. As a result, exploration budgets are being cut, which, in the short term, enables companies to return these savings to shareholders in the form of share buybacks or large dividends, or both.
We make a prediction: higher prices will result. No question. From the sheet of plywood to your monthly fuel, the commodity budget will skyrocket like a scalded cat. This has a net effect on consumption (the “C” in our GDP equation).
Underinvestment in the commodity space, even if well intentioned, will lead to higher prices and a host of unintended consequences.
Share Buybacks
Some companies will redeploy their profits by buying back their shares on the open market. There is nothing inherently wrong with this activity. In some cases, one can argue it is warranted when companies cannot redeploy their profits quickly enough in new investments. Some companies will even borrow at current historic low interest rates to finance these shares buybacks. This is where we find fault.
If a company’s management decided to borrow $3 billion for investing in plants and equipment as well as in marketing and distribution to launch a new product, some investors would view the decision as bold, while others would applaud such a future-oriented investment. However, if management decided to use that loan to buy back its shares, it would be acting as a short-term buyer for these shares and the value of the shares would rise temporarily. But what happens to the remaining shareholders once the buying is over? The company has no plant and no new product, but holds the same debt. Which company would you prefer to own?
Kimberley-Clark (“KMB”) (below) is an example:
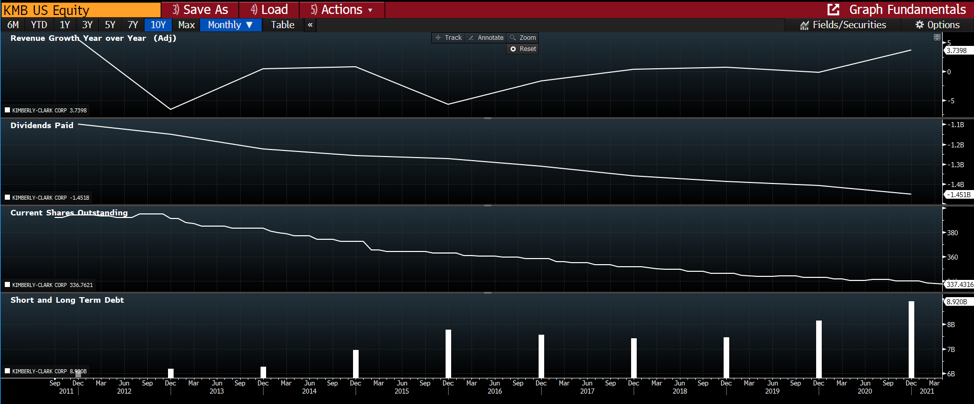
KMB makes paper products of all kinds. The problem is, its revenue growth is lacklustre (see the first panel atop). The company sports a great dividend (around 3.35%), but has been spending a substantial sum buying its shares on the open market (share buybacks – 3rd panel atop), resulting in nearly 20% fewer shares outstanding, and thus, lower dividend payments (second panel). However, these share buybacks and dividend payments have been largely financed by a substantial increase in debt (last panel).
As investors, we all suffer from a perverse short-term vision focus. Share buybacks can incite this short-term thinking. However, employees, communities depending on companies, as well as existing and potential clients all lose when companies focus on share buybacks instead of redeploying capital toward new investments. The unintended consequences of share buybacks are that current shareholders and management are compensated for underinvesting.
History Lesson –Bull Markets and Demographics
Demographics and economics have a direct correlation. Did you know that demographics can also influence the equity markets? Direct causality is less straightforward, but the impact of demographics on the markets is undeniable. The fortunes of many publicly traded companies will be affected by large demographic shifts.
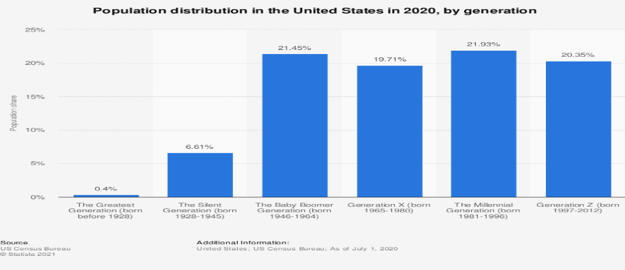
Household formation and immigration are two of the most powerful demographic forces that can affect economies. Baby boomers (born between 1946 and 1964) currently represent about 21% of the U.S. population. What boomers buy, sell and consume influences the economy to this day. As for millennials (born between 1981 and 1996), they represent nearly 22% of the population in America (see following chart).
There is a well-known hypothesis that economic agents (read people) are at their most economically active (in that they produce more than they consume, from a societal point of view) between the ages of 39 and 54.
If we follow this thesis, bull markets should follow this trend and crest when the large cohorts are at the peak of their economic activity (ages 39 to 54). For boomers, the oldest boomer turned 39 in 1977 and turned 54 in 2005. The oldest millennial turned 39 in 2020 and will celebrate their 54th birthday in 2035.
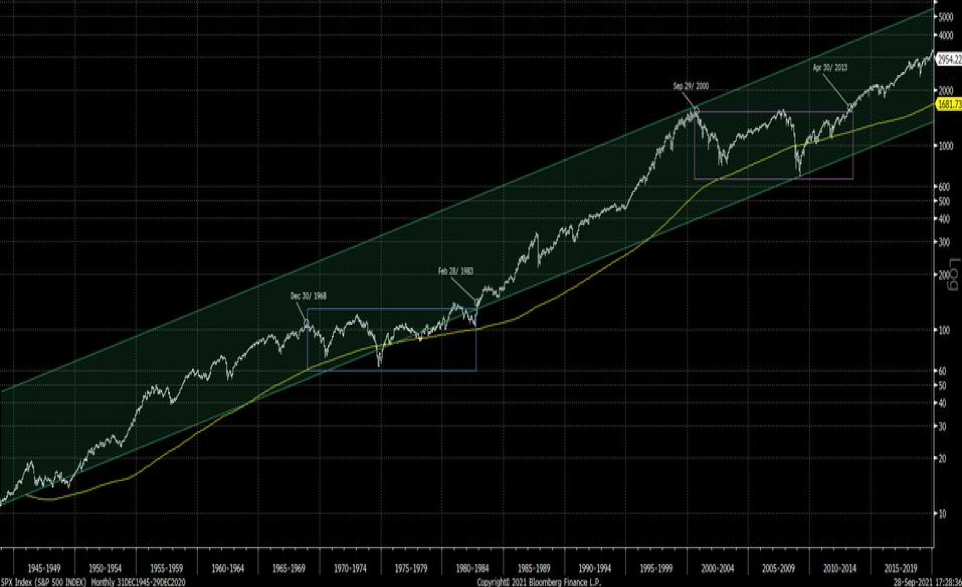
What you see above is the S&P 500 index price evolution from December 1945 to December 2020. The green trend channel is the price action of the index between those two periods. The slope of the curve coincides with the annual expected rate of return, which is just above 7%. I would ask you to focus on the two boxes. These two boxes were the two bear markets since WWII. The first one lasted 15 years and the more recent one 13 years. The end of the first bear market was approximately February 1983 when the oldest boomer was 42 years old. This bull market that began 1983 lasted until late 2000, when the oldest boomer turned 54. The timing is uncanny.
The bear market that began in 2000 lasted until mid-2013. The oldest millennial was then turning 32. The fit is not as neat, but the concept does have some merit. What if the current millennial generation was the next big economic accelerant, and thus provided fuel for the next bull market?
The idea we are trying to convey is not that investing should be driven by demographics, but rather that demographics should be a factor when looking at long-term equity-market return expectations. When markets move up after a large drawdown, there is a natural tendency to believe that the next pullback is imminent. We must be open to the fact that we may be in a secular bull market for equities. Bull markets do have bouts of volatility. The 1987 crash as well as the 20% corrections of 1990 and 1998 occurred during such a secular bull market.
Conclusion
We remain steadfast in our approach to be open and prepared both for better-than-expected and worse-than-expected outcomes. We will react and adapt as information and data (as opposed to headline noise) support making judicious portfolio changes.
We tend to do most of our buying of new positions during softer markets, as valuations become compelling. We do not need to presume that the market has reached a bottom (which would be “market timing”), but we keep a longer-term view when short-term prospects are negative and investors’ mood is more cautious. Of course, being early to act on a trend and being wrong might often look very similar initially, but carefully vetting the quality of the business will usually lead to a profitable outcome for the stock.
As always, we are honoured for the trust you have placed in all of us to manage your investments and we remain available if you have any questions or concerns.