How do Portfolio Managers view long term growth?
I will often repeat that I am never as incompetent as a down market can make me look, nor as gifted as a bull market can make me feel.
This week, we will look at how market can outperform or underperform their long-term growth rates for at least five years. It is entirely normal and to be expected.
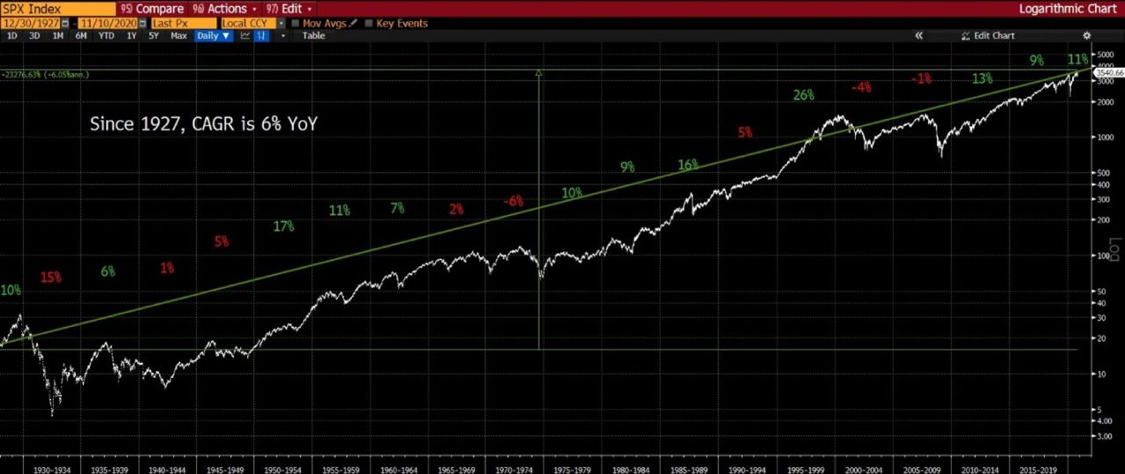
Here we’ve charted the S&P 500 since 1927, showing recessions, expansions, and everything in between. Each 5-year timeframe is shown with the average annual percentage increase in value of the index, excluding dividends. From 1927 to present day 2020, the overall market has delivered returns that of 6% compound annual growth rate.
Sometimes the market front loads (above the LT average) returns such as the 1990-1995 but only to underperform for the following decade.
The point is that you have to stand by your investment convictions and accept that in order to have long term outperformance, expect to have periods of under whelming performance.
British economist John Maynard Keynes said it best, “The market can stay irrational longer than you can stay solvent.”
One of the best stocks of all time is one that very few investors would have guessed
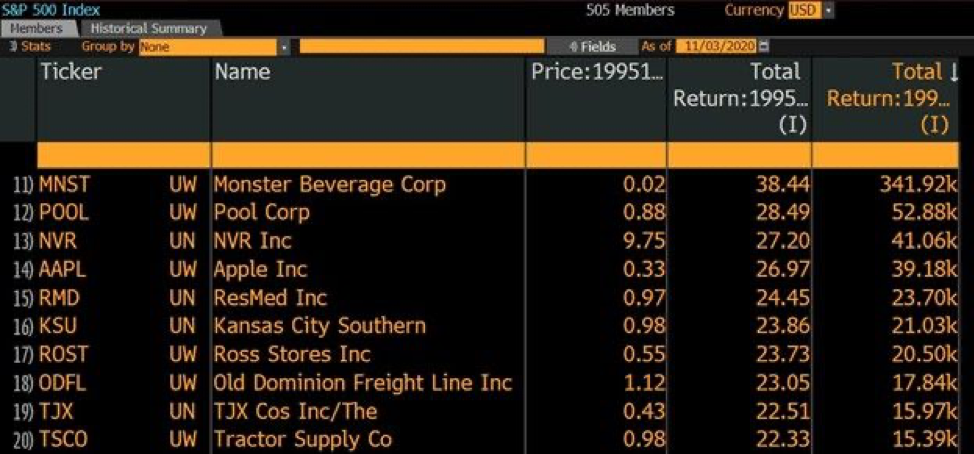
Did you know that most of the best performing stocks of the last 30 years ARE NOT tech stocks? We picked 1995 as it was pre tech bubble 1.0. What if I told you that the companies operated in the beverage, pool, retail or railroads, would you be surprised?
The usual suspects like Apple and Amazon are bound to be mentioned by most. How about a stock with a total return that is 10x what Apple is since 1995? Enter Monster Beverage Corp, the Energy drink brand that went from small cap penny stock with a dozen employees to a true Wall Street darling. Since this day in 1995, Monster Beverage has a total return of almost 342 thousand times! That equates to 38% per year, every year. Monster’s top line revenue in 1995 was around $34 million, growing to over $4.2 billion last fiscal year. Monster Beverage accounts for a third of the energy drink market in the US. Very few penny stocks show any type of sustained success, let alone the highest total return over the past 25 years.
Little known fact…most of these companies were cash flow positive from the get-go…and most were profitable since the early days.
Election Year: How have markets performed under different Presidents?
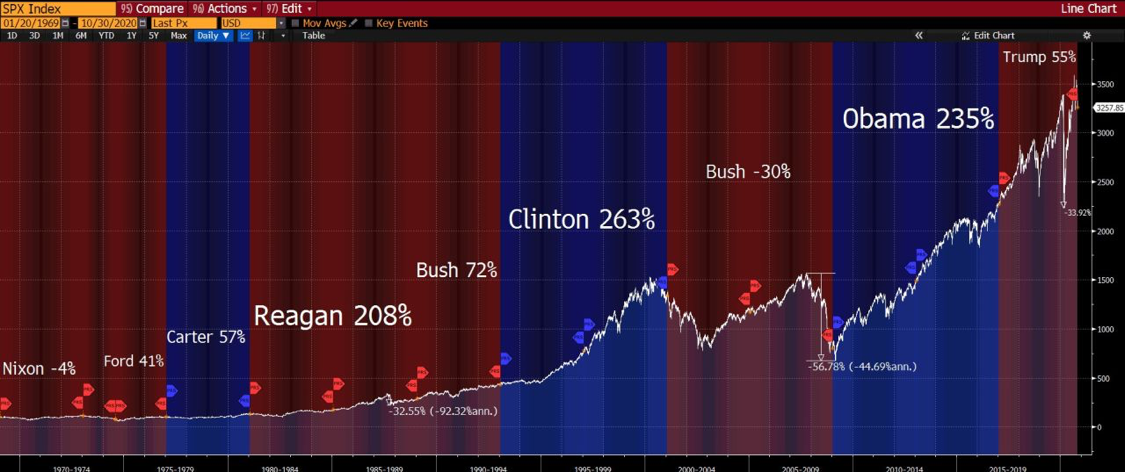
Do elections move markets? Maybe in the initial days following Election Day, the extreme short-term market shock usually plays a role. But over the long term, the exact correlations are difficult to pinpoint. Here is S&P 500 since 1970 with the President & Political party in power at the time. Total return is calculated assuming dividends are reinvested in the index. Interesting to note, that in the first month after Obama was elected, the market plummeted 15%.
Every four years in the United States there is an overamplified narrative that the winning candidate will have a profound impact on a portfolio. If only things were this simple. We’ve highlighted the biggest recessions since 1970, and massive market downturns are not at all attached to one party.
Bulls and Bears simply do not know or care about Democrats or Republicans. So where does the S&P 500 go from here? In the short term, we have no idea…so look for our poll on Monday as perhaps some of you will have some insights.
The usual suspects in Corporate America
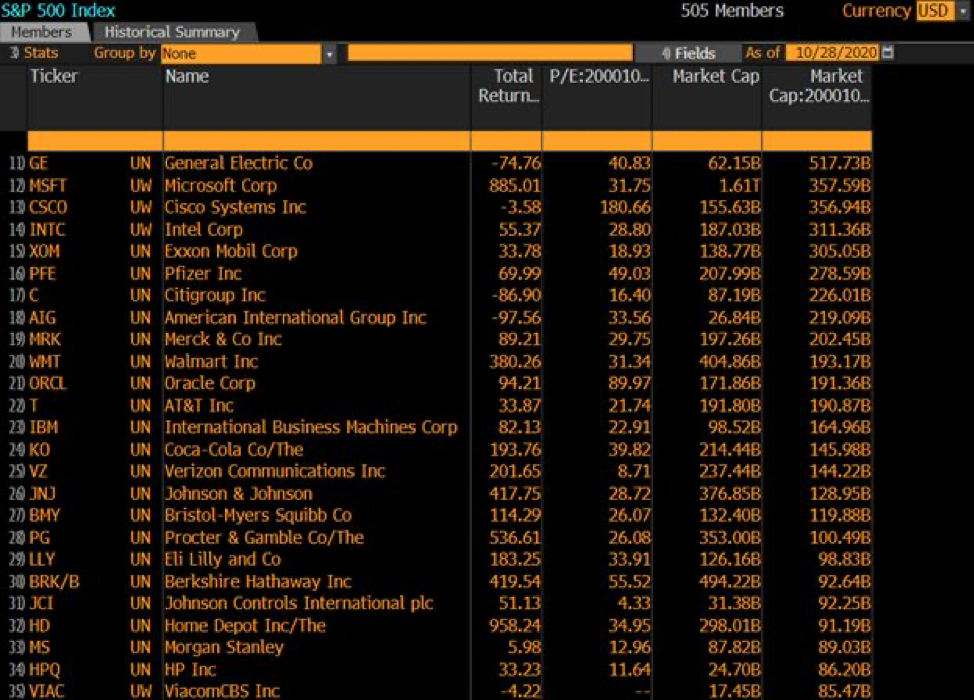
On this day in 2000, General Electric (GE) was the S&P 500’s most valuable company, with a market cap of over half a trillion dollars. GE’s share price peaked in late August 2000, dramatically falling soon after that date. The fallen angels on this list show that no company is immune to sustained failure, no matter how big they are at some point in time. In August of 2000, GE & Microsoft combined for 10% of the market cap of the S&P 500.
This Bloomberg screenshot shows the top 25 companies by market cap on October 27, 2000, along with their respective P/E ratios. Today’s market cap is also listed, with some of the usual suspects among the world’s best companies. Total return is the tell all sign of the best investments 20 years ago, with Home Depot & Microsoft leading the way.
My takeaway? Water finds its own level. The best investments compound over a long-term time horizon, and it always starts with a great business. Famed investor Peter Lynch said, “buy a business that any idiot can run – because sooner or later, any idiot is probably going to run it.”
However, not all businesses make it. Beware that buy and hold can turn into buy and hope.
GE, Wall Street Darling: Past Performance is no guarantee of future results
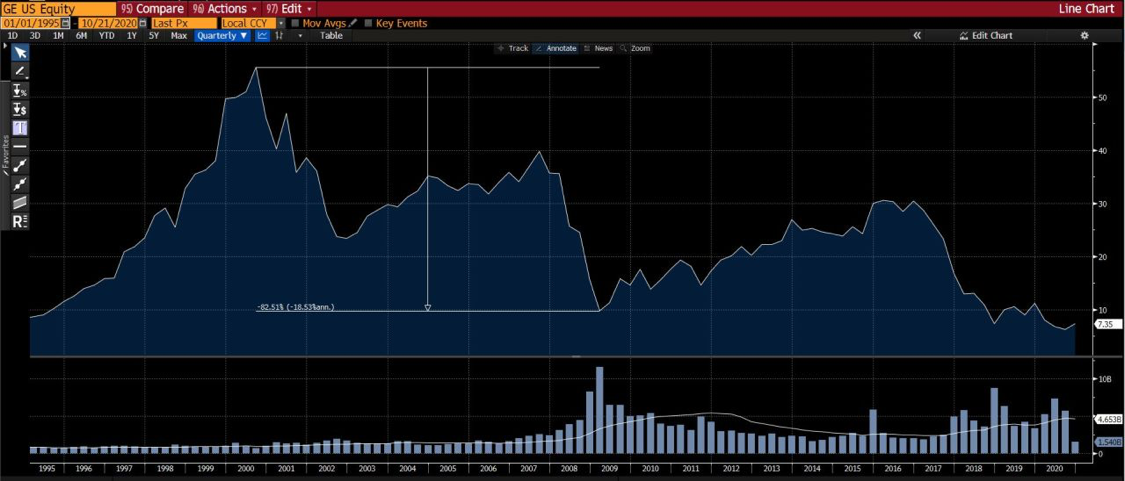
In the early 2000s, General Electric (GE) was an institutional darling that was almost unanimously loved Wall Street. Who doesn’t want to own the biggest and best stock out there? GE’s stock was nearly 30% bigger by market cap than Cisco Systems, then the second largest company in the S&P500. GE had prospects to grow even larger, until it didn’t. GE fell off a cliff shortly after and has never showed sustained recovery. After legendary CEO Jack Welch left the company in 2001, things just weren’t the same. So why chase winners in the markets? Isn’t it fun to bet on the favorites, especially the biggest favorites?
Valuations matter. GE showed a historic run up to their peak midway through 2000, but just four years later it had plummeted over 80%. For mega cap behemoths, getting ahead is one thing, but staying ahead is an entirely different ball game.
Speaking of winning, the Yankees won the World Series in 2000, around GE’s half a billion-dollar evaluation. This year’s World Series teams were both weak teams in 2000: Tampa Bay Rays came in last in their division and the L.A. Dodgers were second in their division and missed the playoffs with a meek .571 winning record. This year’s winners are destined to be tomorrows has been.
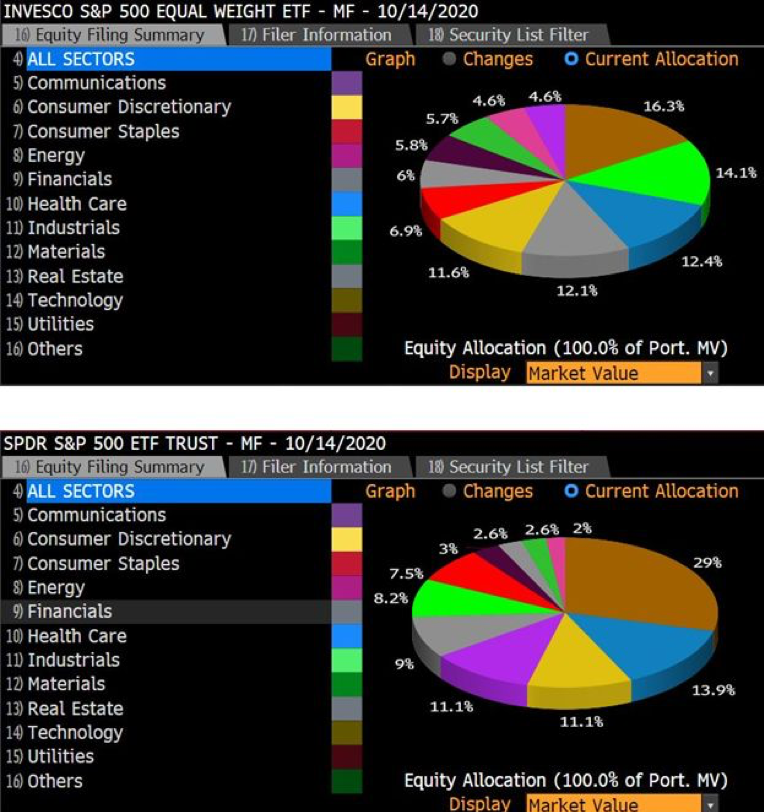
S&P 500 Market-Cap Weighted ETF vs. S&P 500 Equal Weight ETF
If you follow the stock market, you’ll know how the S&P 500 results are mostly driven from the performance of about 5 stocks this year.
How does the S&P 500 ETF (SPY) stack up against an equal weighted ETF? This equal weighted ETF is called RSP, and it is comprised of the exact same names as the S&P 500, just every company is valued equally, hence the name.
When all names are given an equal weight, the performance of the RSP ETF is relatively flat depending on the exact time horizon an investor is looking at. But where do the largest gaps and outright disparities lie? The outright performance of Big Tech in 2020 has dominated headlines, and those headlines aren’t far off by any stretch.
The market-cap weighted SPY ETF is composed of 25%+ tech, compared to just 15% in the RSP ETF. The vast outperformance by the information technology sector has created a strong overall perceived tailwind for the S&P 500 Index as a whole.
FAANGM has distorted how investors view an index, and maybe more concerning is how it seems to obscure the weak market depth outside of these mega-caps. In fact, out of all 500 stocks in the S&P 500, just 15 total have a respective weighting of more than 1% each!
Are we are reaching tech bubble levels of concentration?
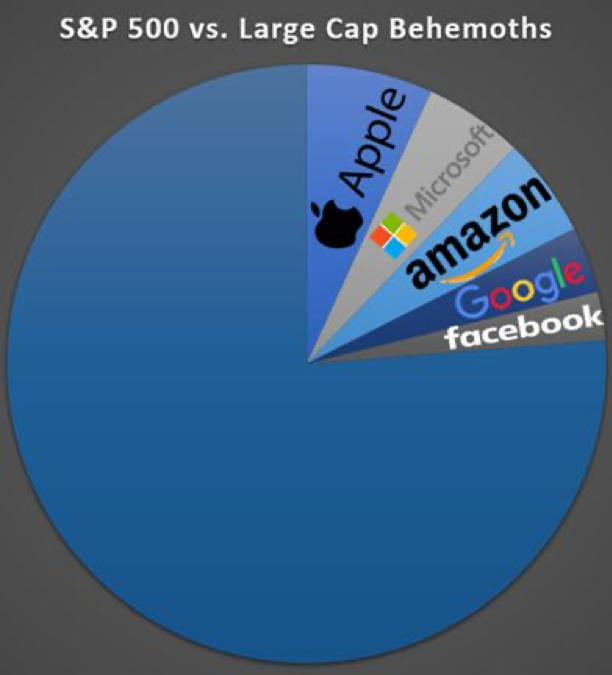
The combined market value of the top 5 stocks in the S&P 500 is over $6.8 trillion, while the remaining 495 stocks have a combined value of just over $22 trillion. These 5 tech giants make up nearly a quarter of the S&P 500; its easy to see why they have an outsized impact on the broader stock market.
Along with select other companies, these names continue to rapidly outperform the S&P 500 Index. If there was ever a doubt of the network effect, each of these companies proves otherwise.
Each additional user or search makes each of these companies more and more valuable. Important to note though, what type of investors are fueling this rise for today’s top tech names? Stay tuned for next week.
S&P 500 vs Only the top 10 in the S&P 500
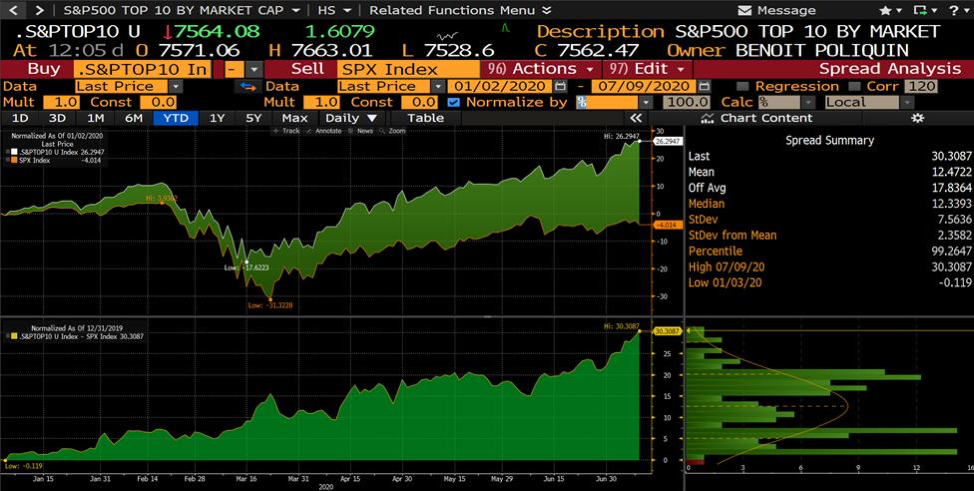
Interesting chart for all you investors out there. Through July 9th, the S&P 500 was down 4% yet the top 10 stocks of the S&P 500 was UP 26%. Perhaps someone can remember a similar circumstance, but I cannot. In 20+ years of managing investments, I dot believe I have ever seen the focus in performance so extreme. (NO, 2001 was not this extreme for the S&P 500, but it was for the TSX).