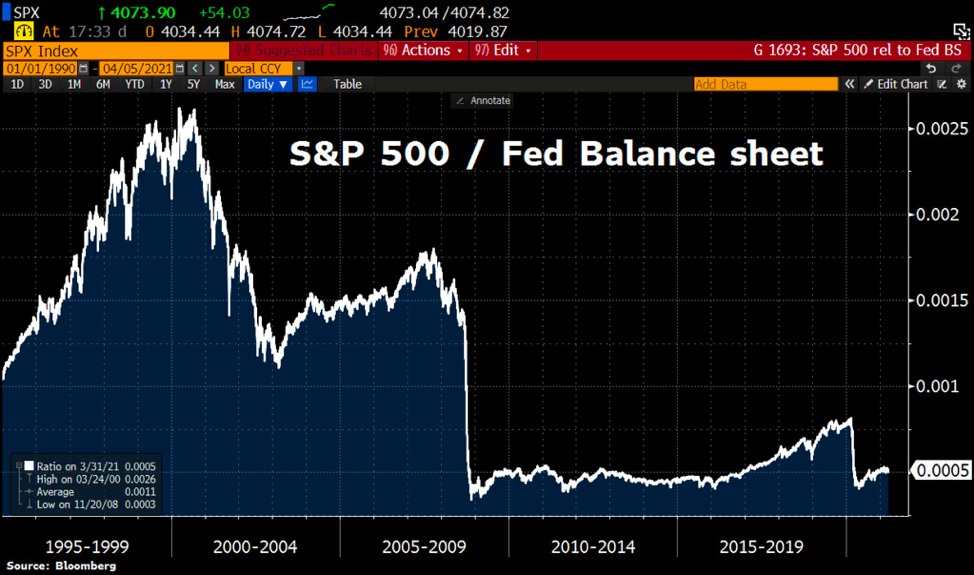
Stocks have largely traded sideways since 2008
As the S&P500 continues to hit all time highs, it’s still trading at roughly the same level to 2008 compared to the Fed’s balance sheet. Is it that most of the gains have simply come from the Fed expanding their balance sheet?
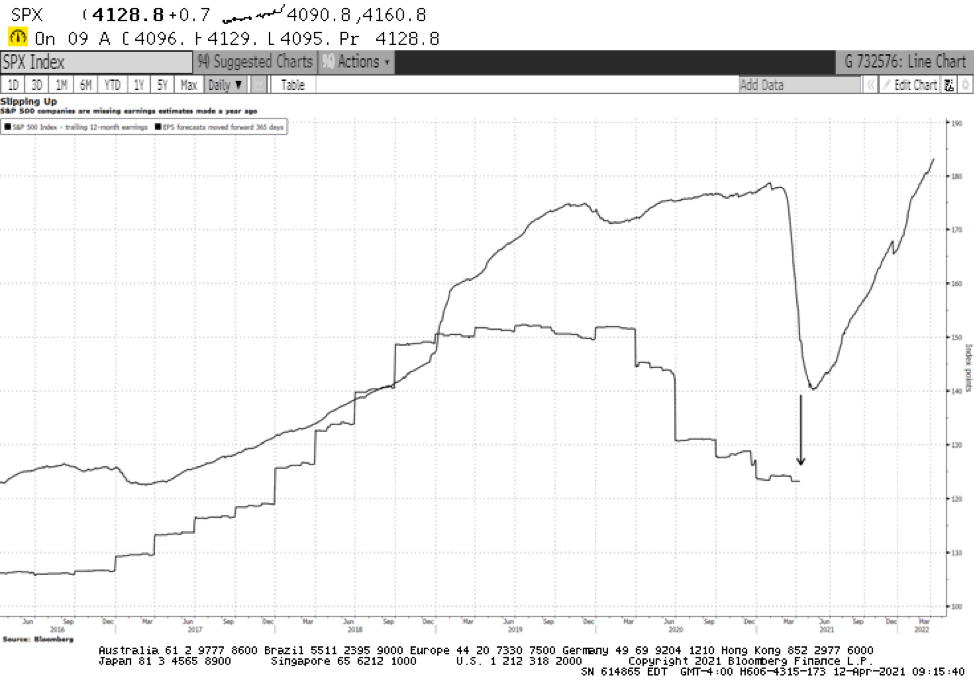
Equity Research Desks and their earnings predictions
News Flash – Earnings from the S&P 500 components are being reported at lower levels than where analysts had predicted 12 months ago.
What it means for you: some stocks prices have not yet been adjusted to these lower results.
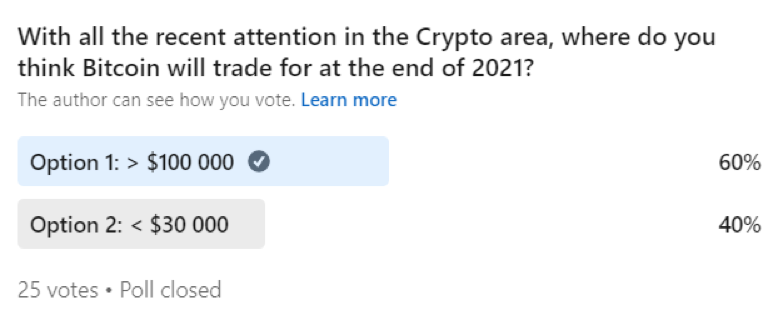
Bitcoin’s future price prediction garner mixed results
This week marked one of the Crypto community’s biggest days to date with Coinbase, a cryptocurrency exchange platform, direct listing on the NASDAQ. With Bitcoin, Ethereum, and other notable coins hitting all time highs recently, this space seems to have more momentum than ever.
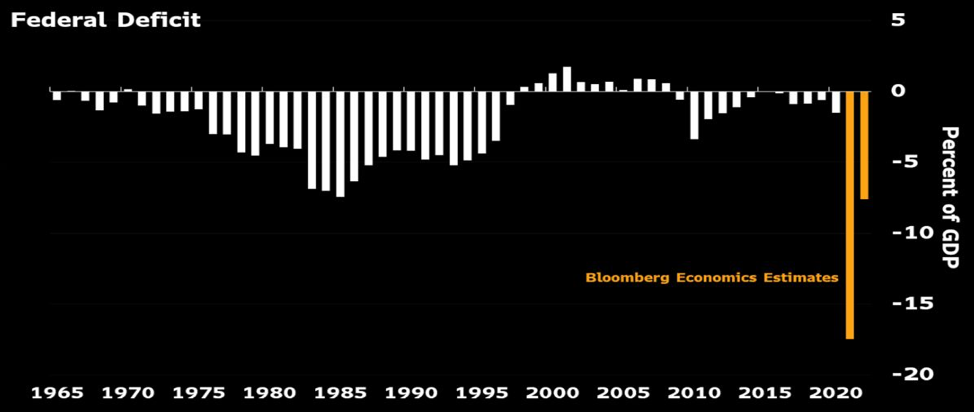
Canada’s Federal Deficit is set to balloon in coming years
Governments across the world seemed to have adopted deficits as panacea to acquire political capital. Deficits are financed by the investors, and of late, the central banks. While central banks are not price sensitive by definition, a day will come when investors will refuse to participate unless the compensation is increased. Like any commodity, it is the marginal buyer who sets prices. It is likely investors will be that marginal buyer.
What would make investors worry about buying Canadian debt? The ability to service debt is one. The chart illustrates federal deficit ratio as % of the economy; it is 3X what it was in the early 90’s. The powers that be must remember that bond investors are ruthless and agnostic…and not swayed by talking points, speeches, selfies, waterworks or hair products. The only thing that matters to lenders is return on capital adjusted for risk of the capital; higher risk = higher returns. It is immutable.
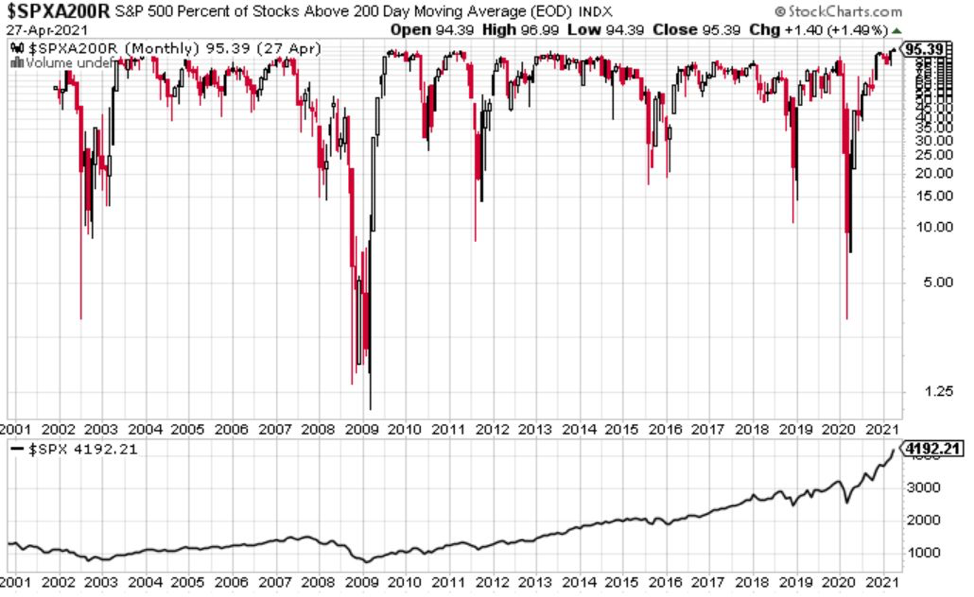
Earnings Season and more stocks keep hitting all time highs
Fellow investors…do you feel like every single stock you look at is high? Do your emotions move from FOMO to FOLG (Fear of Losing Gains) and back again. The chart will confirm your feeling, but won’t help you determine if it is time to lighten up or add to your positions.
Right now 95% of all stocks in the S&P 500 are above their 200-day (Long Term) moving average. The problem is that it is a terrible indicator. We have been here in 2007 and early 2020 we all know how the following 12 months treated equity investors. But then again…we have seen high readings (perhaps not the 95%, but high 80’s) most of the time from 2010 to 2015 when the S&P 500 moved higher.
Conclusion?
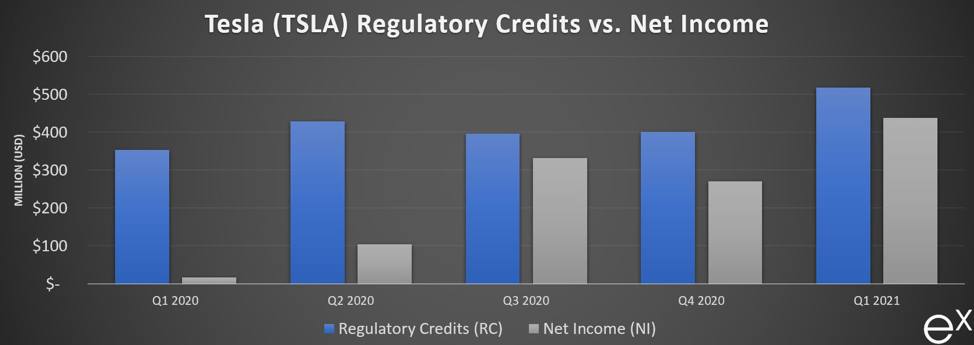
Tesla grows Net Income, while Regulatory Credits grow in proportion
After reporting 2021 Q1 results earlier this week, Tesla’s financials are once again top of mind for many investors and followers of finance. How much of their net income is tied up in regulatory credits, and more importantly, how long can the credits last? Here we’ve highlighted quarterly net income vs. regulatory credits for the past year. As more traditional automakers enter the EV space, can Tesla maintain their moat?