This week surprised many investors. As of Friday morning (Feb 9/2018), the S&P 500 index is down over 200 points to close on Thursday at 2581 or almost 10% while the S&P TSX Composite index is down 650 points or 4% to close on Thursday at 15,065. While Friday morning looks better, let’s look at what happnened this week.
The sell off this week was effectively a result of two situations. On one hand, better economic news delivered by way of a jobs report that showed lower unemployment numbers. On that news, interest rates rose and stocks sold off.
So far, this is a non-event; investors simply repriced future corporate profits in light of higher interest rates. Just like the butterfly can create an earthquake half way around the world, the better economic news impacted investors in an unforeseen way.
For the better part of 2017, many traders would structure a position by shorting (selling) the futures contracts (usually 30 or 60 days hence) on the VIX. The VIX is the measure the 30-day volatility (up and down movement) of the S&P 500 index. As time marches forward, the 30 or 60 day contract which is priced about 10% higher than the spot (current) VIX level falls toward that level. In plain English, hedge funds would “create” money by selling the futures on the VIX and make 10% every 30-60 days.
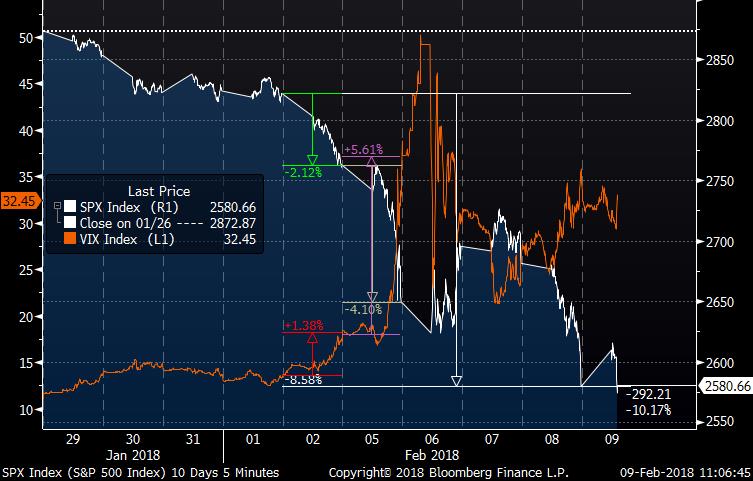
Because as the chart below illustrates, the VIX has been so low for so long, it was a license to print money. However, it is predicated on the VIX staying low. That was the key. The orange lind is the VIX…it fell some 40% while the S&P 500 index went up 32%.
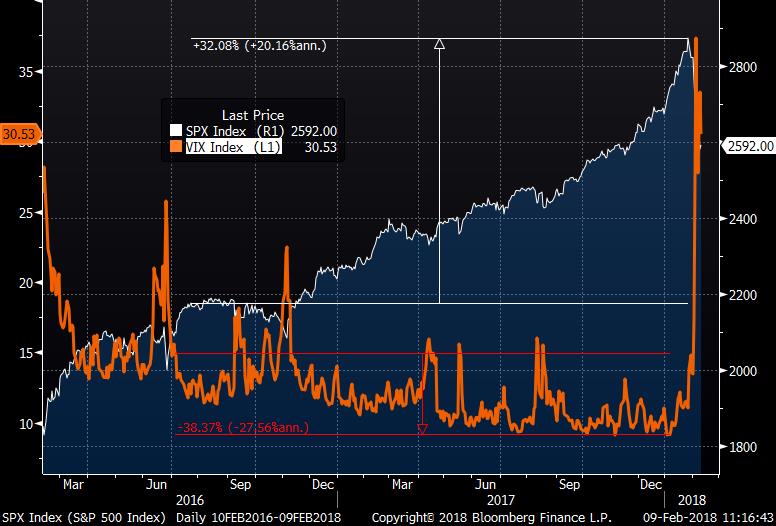
So these genius PhD math propeller heads who run these hedge funds, but were in high school during the last crisis and were born AFTER the 1987 crash, figured that they could simply take the proceeds of the short and invest in the S&P 500. As you can see, the low VIX and the rising index are tied to one another.
So on Friday February 2nd, we had the stock price fall hard on good economic news. This made the VIX rise…which made the propeller heads hurt financially. Not only was the VIX rising (and they are short…so at it rises, they lose), their investment in the index is falling. In short, they are getting hurt on two fronts. Worse still, they have to unwind (buy back) the VIX, which makes it rise…and/or they have to sell the S&P 500 which makes it the problem worse.
So below I have illustrated the past ten days of the S&P 500 and the VIX. On Friday, we saw the market fall 2% (green) and the VIX rise 1%. So far, no problem. But on Monday (February 5th), the VIX went up 5.6% AND the S&P 500 went down 4.1%. For speculators using leverage, this is akin to a combination punch that can lead to a KO.
In Canada, we have had a more muted effect, but in downdrafts, markets tend to move in unison.
I looked on Monday on the daily chart (below) and I look for the 3 o’clock fade. 3pm is when forced redemptions and sale orders come in…so when I see the market fall or accelerate at 3 o’clock, it is a clue that there is selling pressure. The reverse is also true. For the accounts that did not have a lot of cash, we raised cash to close to 20%. We booked gains and we sold some off some the names that were either flat (not very profitable) and one that was at a loss. In short, we sold 6 stocks. Better safe than sorry. What I learned in ’08-’09 is that a sell off is an opportunity…but you need cash to capitalize on the opportunity. In short, we are actively monitoring the situation.