Let us begin with an introduction on OAS (Old Age Security).
Canadian residents are eligible to receive a monthly annuity from the Federal Government once they are 65 years of age or older, provided they meet certain requirements on residency and net income. This benefit is currently valued at $578 per month and represents an outflow from the Government’s general revenues.
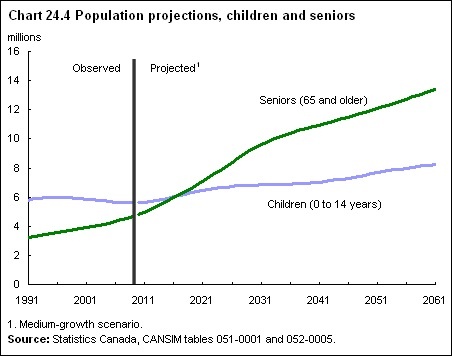
Canada, like many other developed/mature countries, faces an aging population with the trend only projected to increase. Currently only 18% of the Baby Boomer generation has reached aged 65 and the peak won’t reach that age for another 10 years. Imagine by then that 20% will be of retirement age and by 2030 it will rise to above 25%
The chart and table below depict the growing gap between the two age groups with the passage of time.

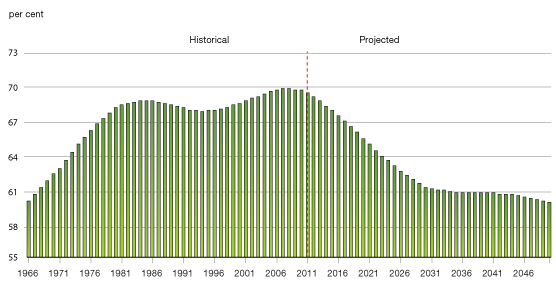
As the population ages and the gap widens, the labor force will begin to shrink. The ratio of elderly to the working age population will only increase over time. This leads to a situation of lower tax revenues and thus larger social payouts, of which OAS is one, for the Government.
The chart below illustrates the potential challenge faced by the government in the coming years.

The data above begs the question, When does OAS become unsustainable for the Government? And if so, will future generations be expected to bear the extra burden?
Let us look at two variables that can either increase or decrease the future burden of the government, depending on their direction of change.
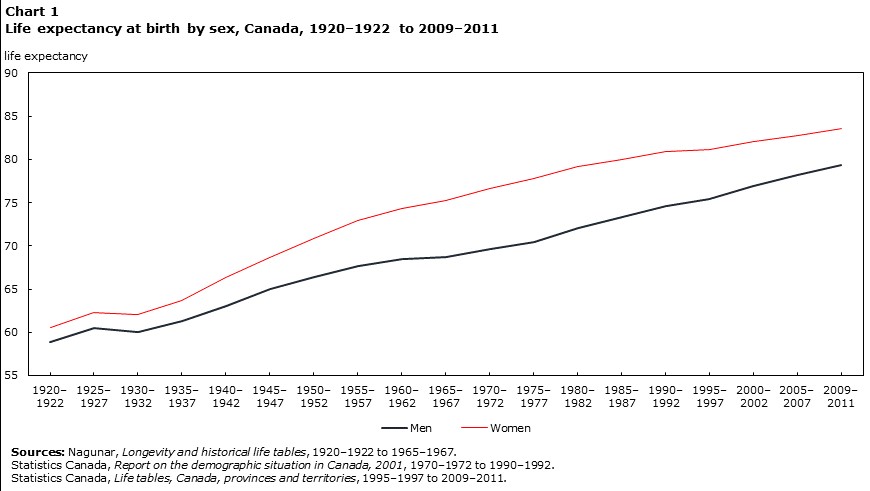
1. Life Expectancy: is the average numbers of years that a person can expect to live based on a few fundamental factors. With the tremendous advancement in Science and Medicine, this variable has been an on upward trend and is projected to continue in a similar fashion.

The life expectancy for males increased from 59 in the year 1920 to 79 in the year 2009. Similarly, the life expectancy for females increased from 61 in the year 1920 to 83 in the year 2009
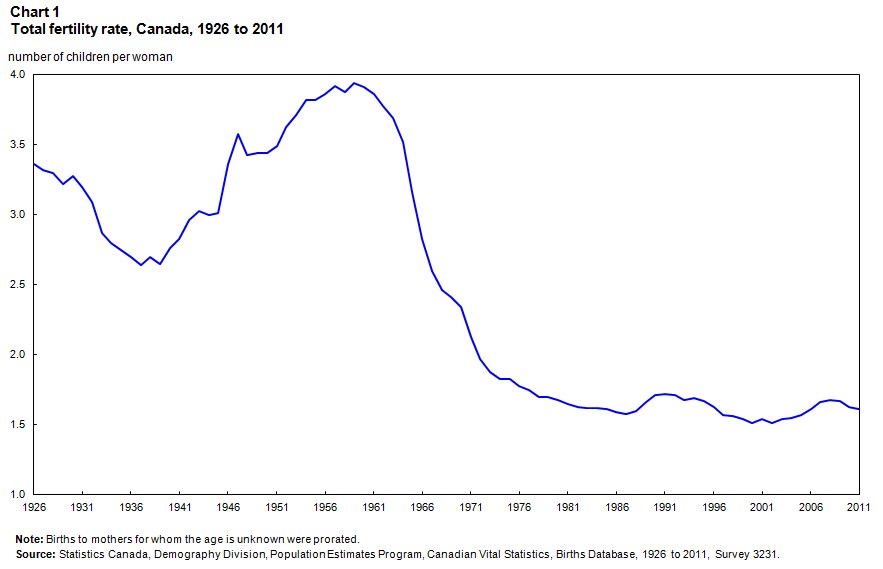
2. Fertility: The fertility rate has been below the replacement rate for many years now, thereby altering the once youthful and growing population structure to that of an aging population and a diminishing future workforce. This is where “immigration” comes in. Can Immigration prevent the decline in the future labor force as a % of the population? Can Immigration help reduce the additional burden on the government? So far, despite Canada having an enviable track record amongst the G20 in immigration rates on per capita basis, the average 250,000 new faces per year (approx. double Canada’s natural growth through births and deaths), is barely keeping up with this first wave of Baby Boomer retirees. So, the notion of relying on immigration as a solution or cure for an accelerating and aging workforce is incorrect and provides false hope.

While this article mainly studies the Government’s ability to continue to sustain OAS in the future, the changing demographic will highlight other spheres of concern:
- The strain on the health care system with lesser number of health practitioners and more patients.
- The lack of private retirement funds and the dependence on the Government for CPP and GIS.
- The pension coverage rate, the proportion of all employees covered by a Registered Pension Plan was a meagre 1% in 2014
Our conclusion identifies a critical need to address a review or counsel of one’s planning as they approach retirement and assess what programs might supplement the assets one has already accumulated to fund an adequate and sustainable retirement lifestyle. In this rapidly changing climate, one cannot afford to wait.


